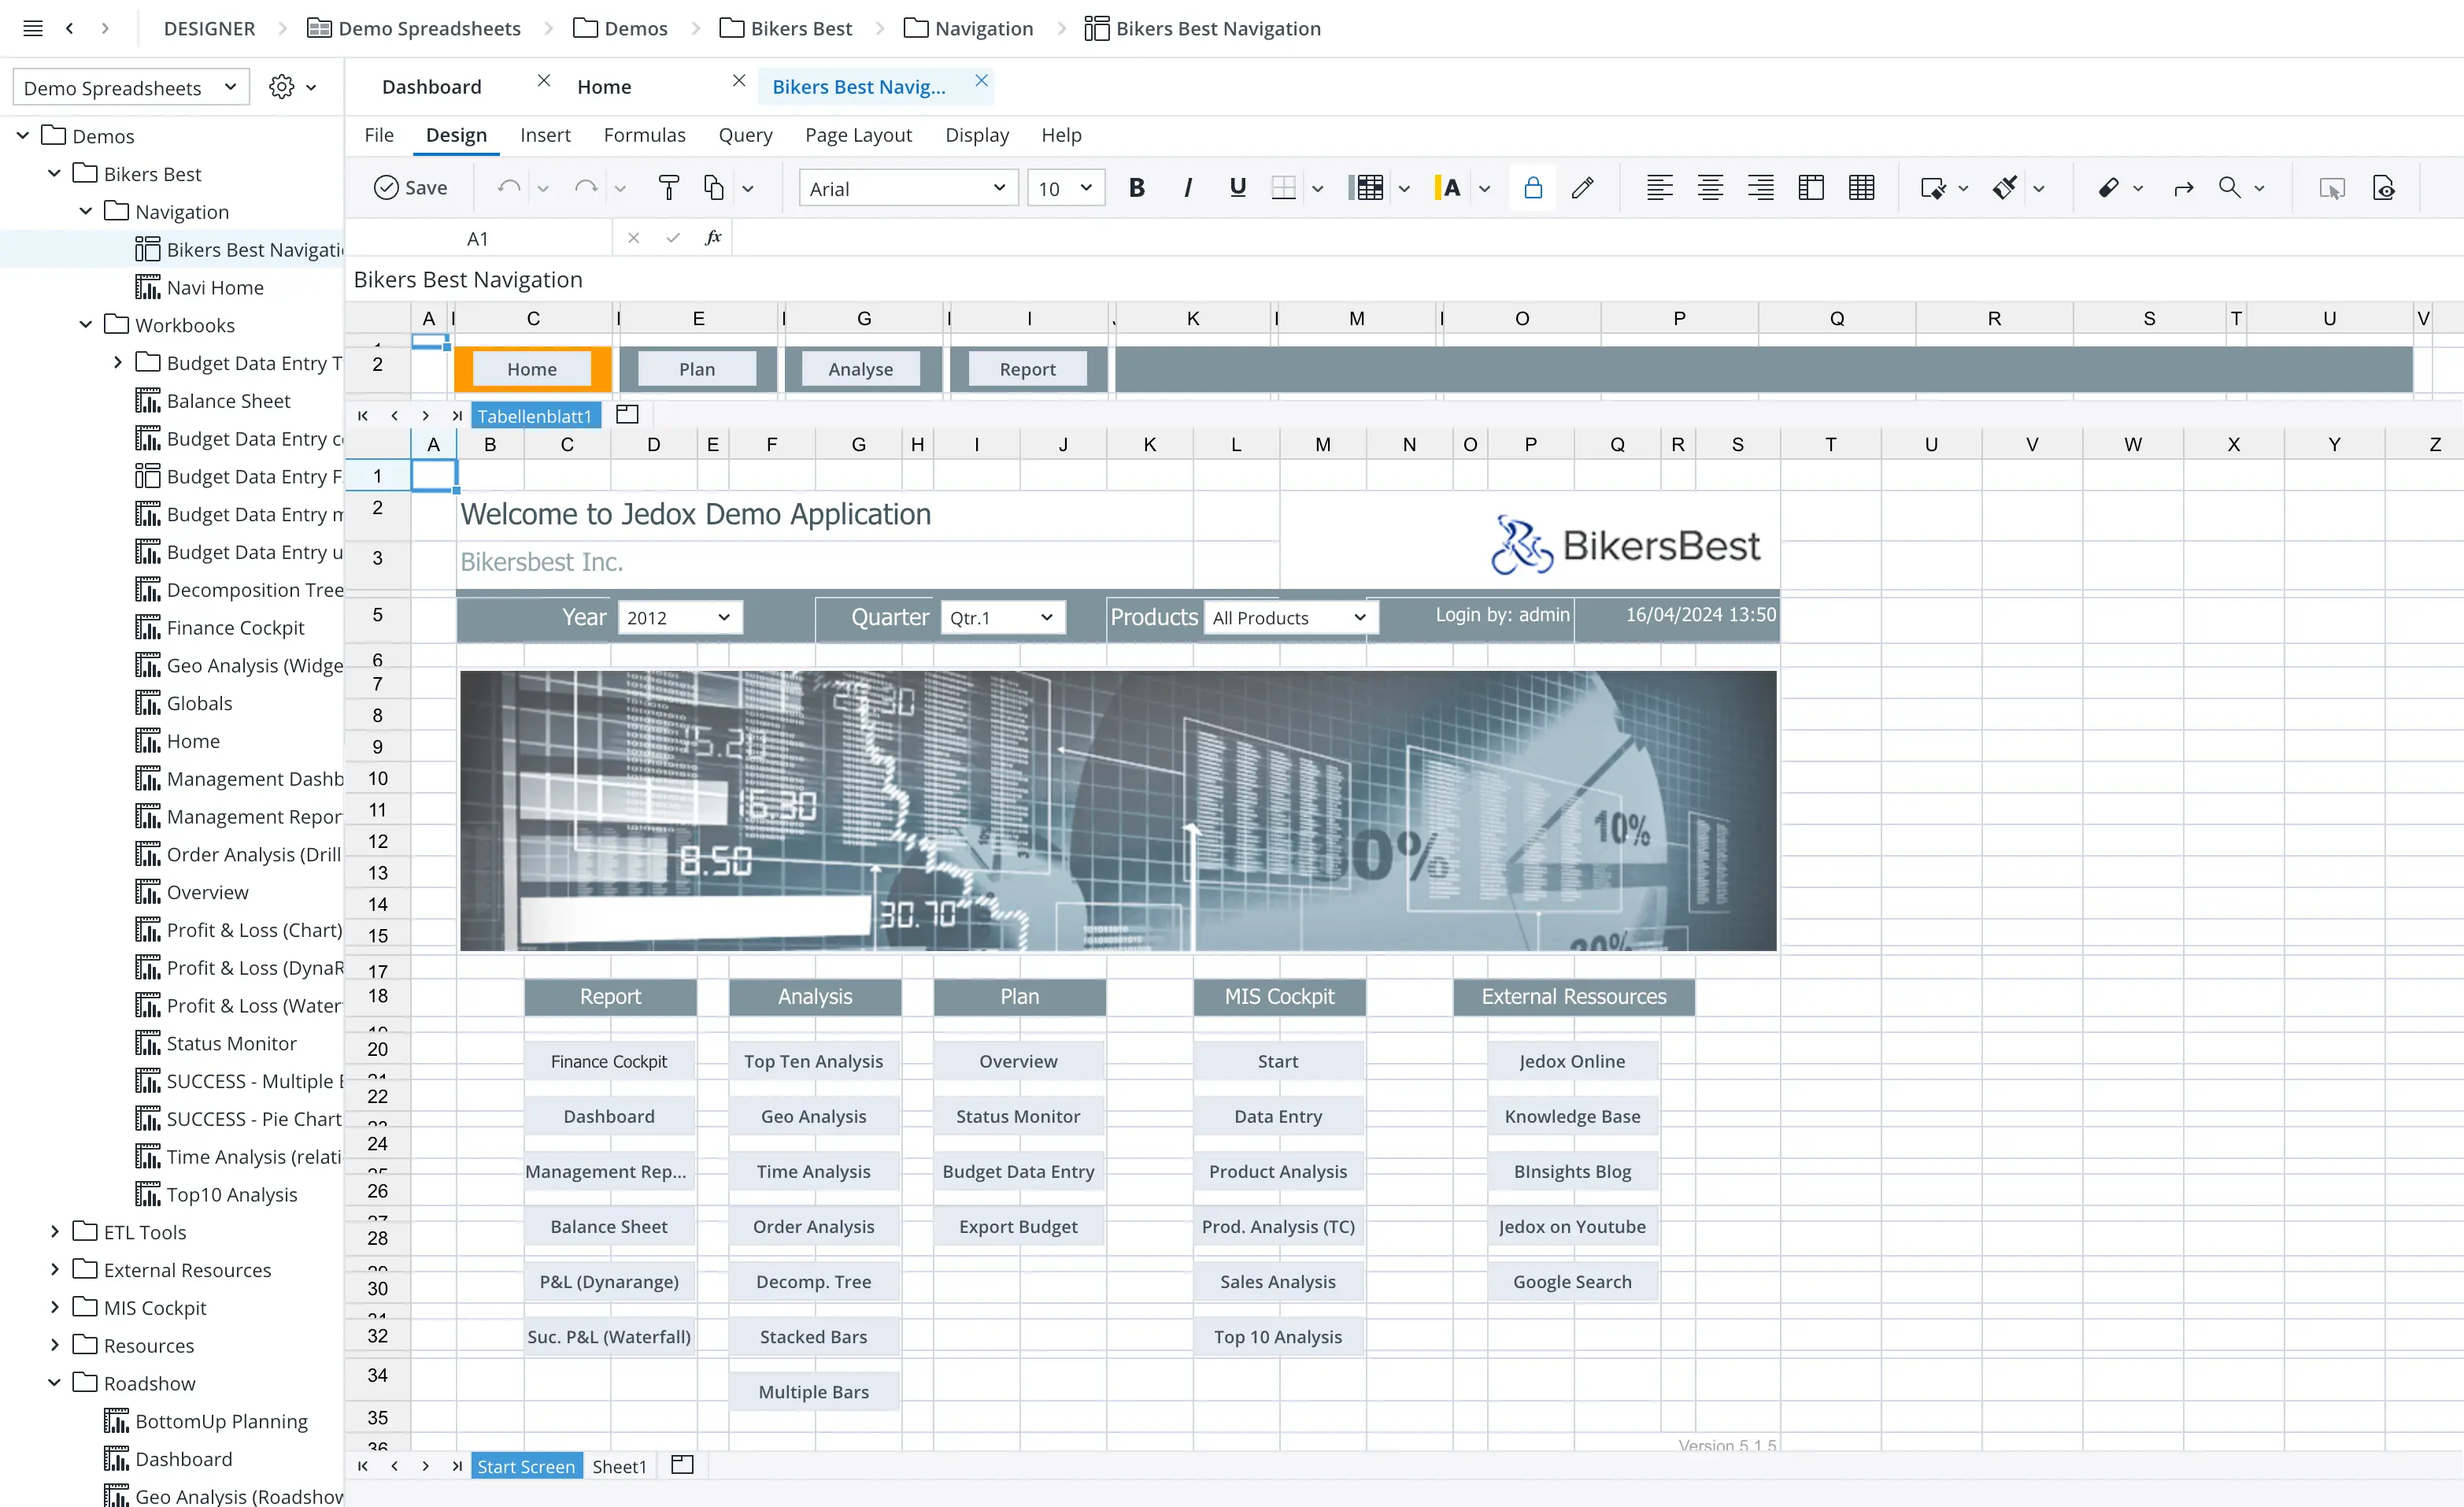
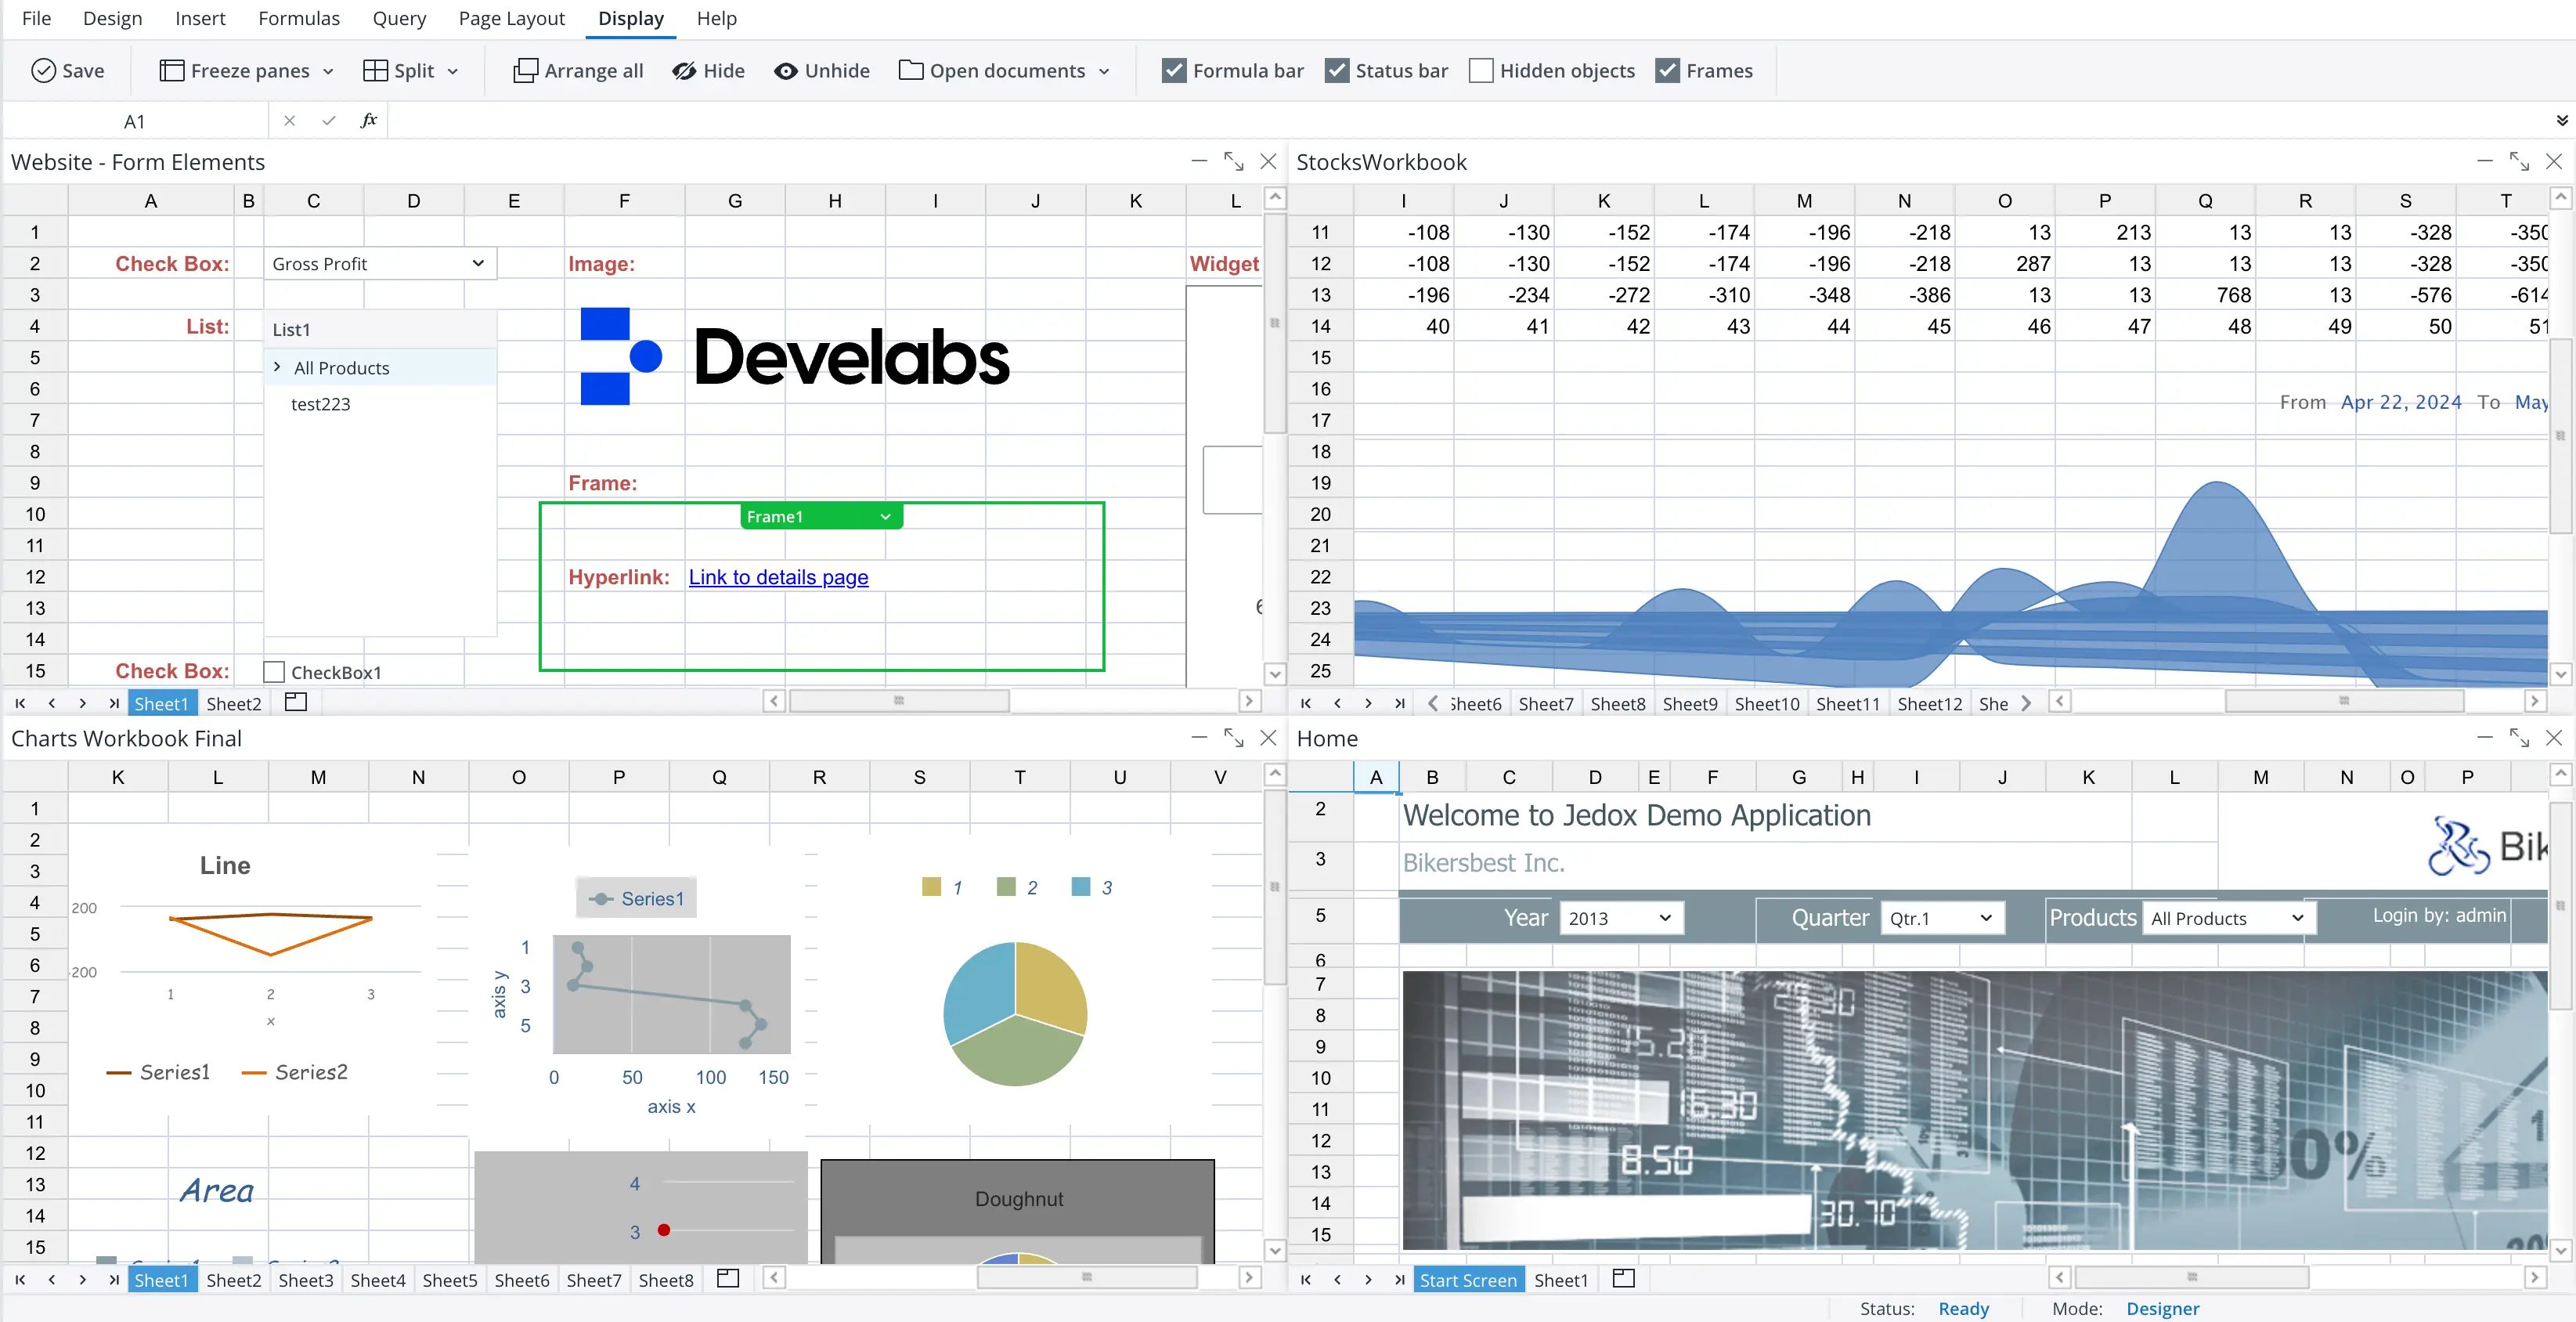
Spreadsheet Report Designer
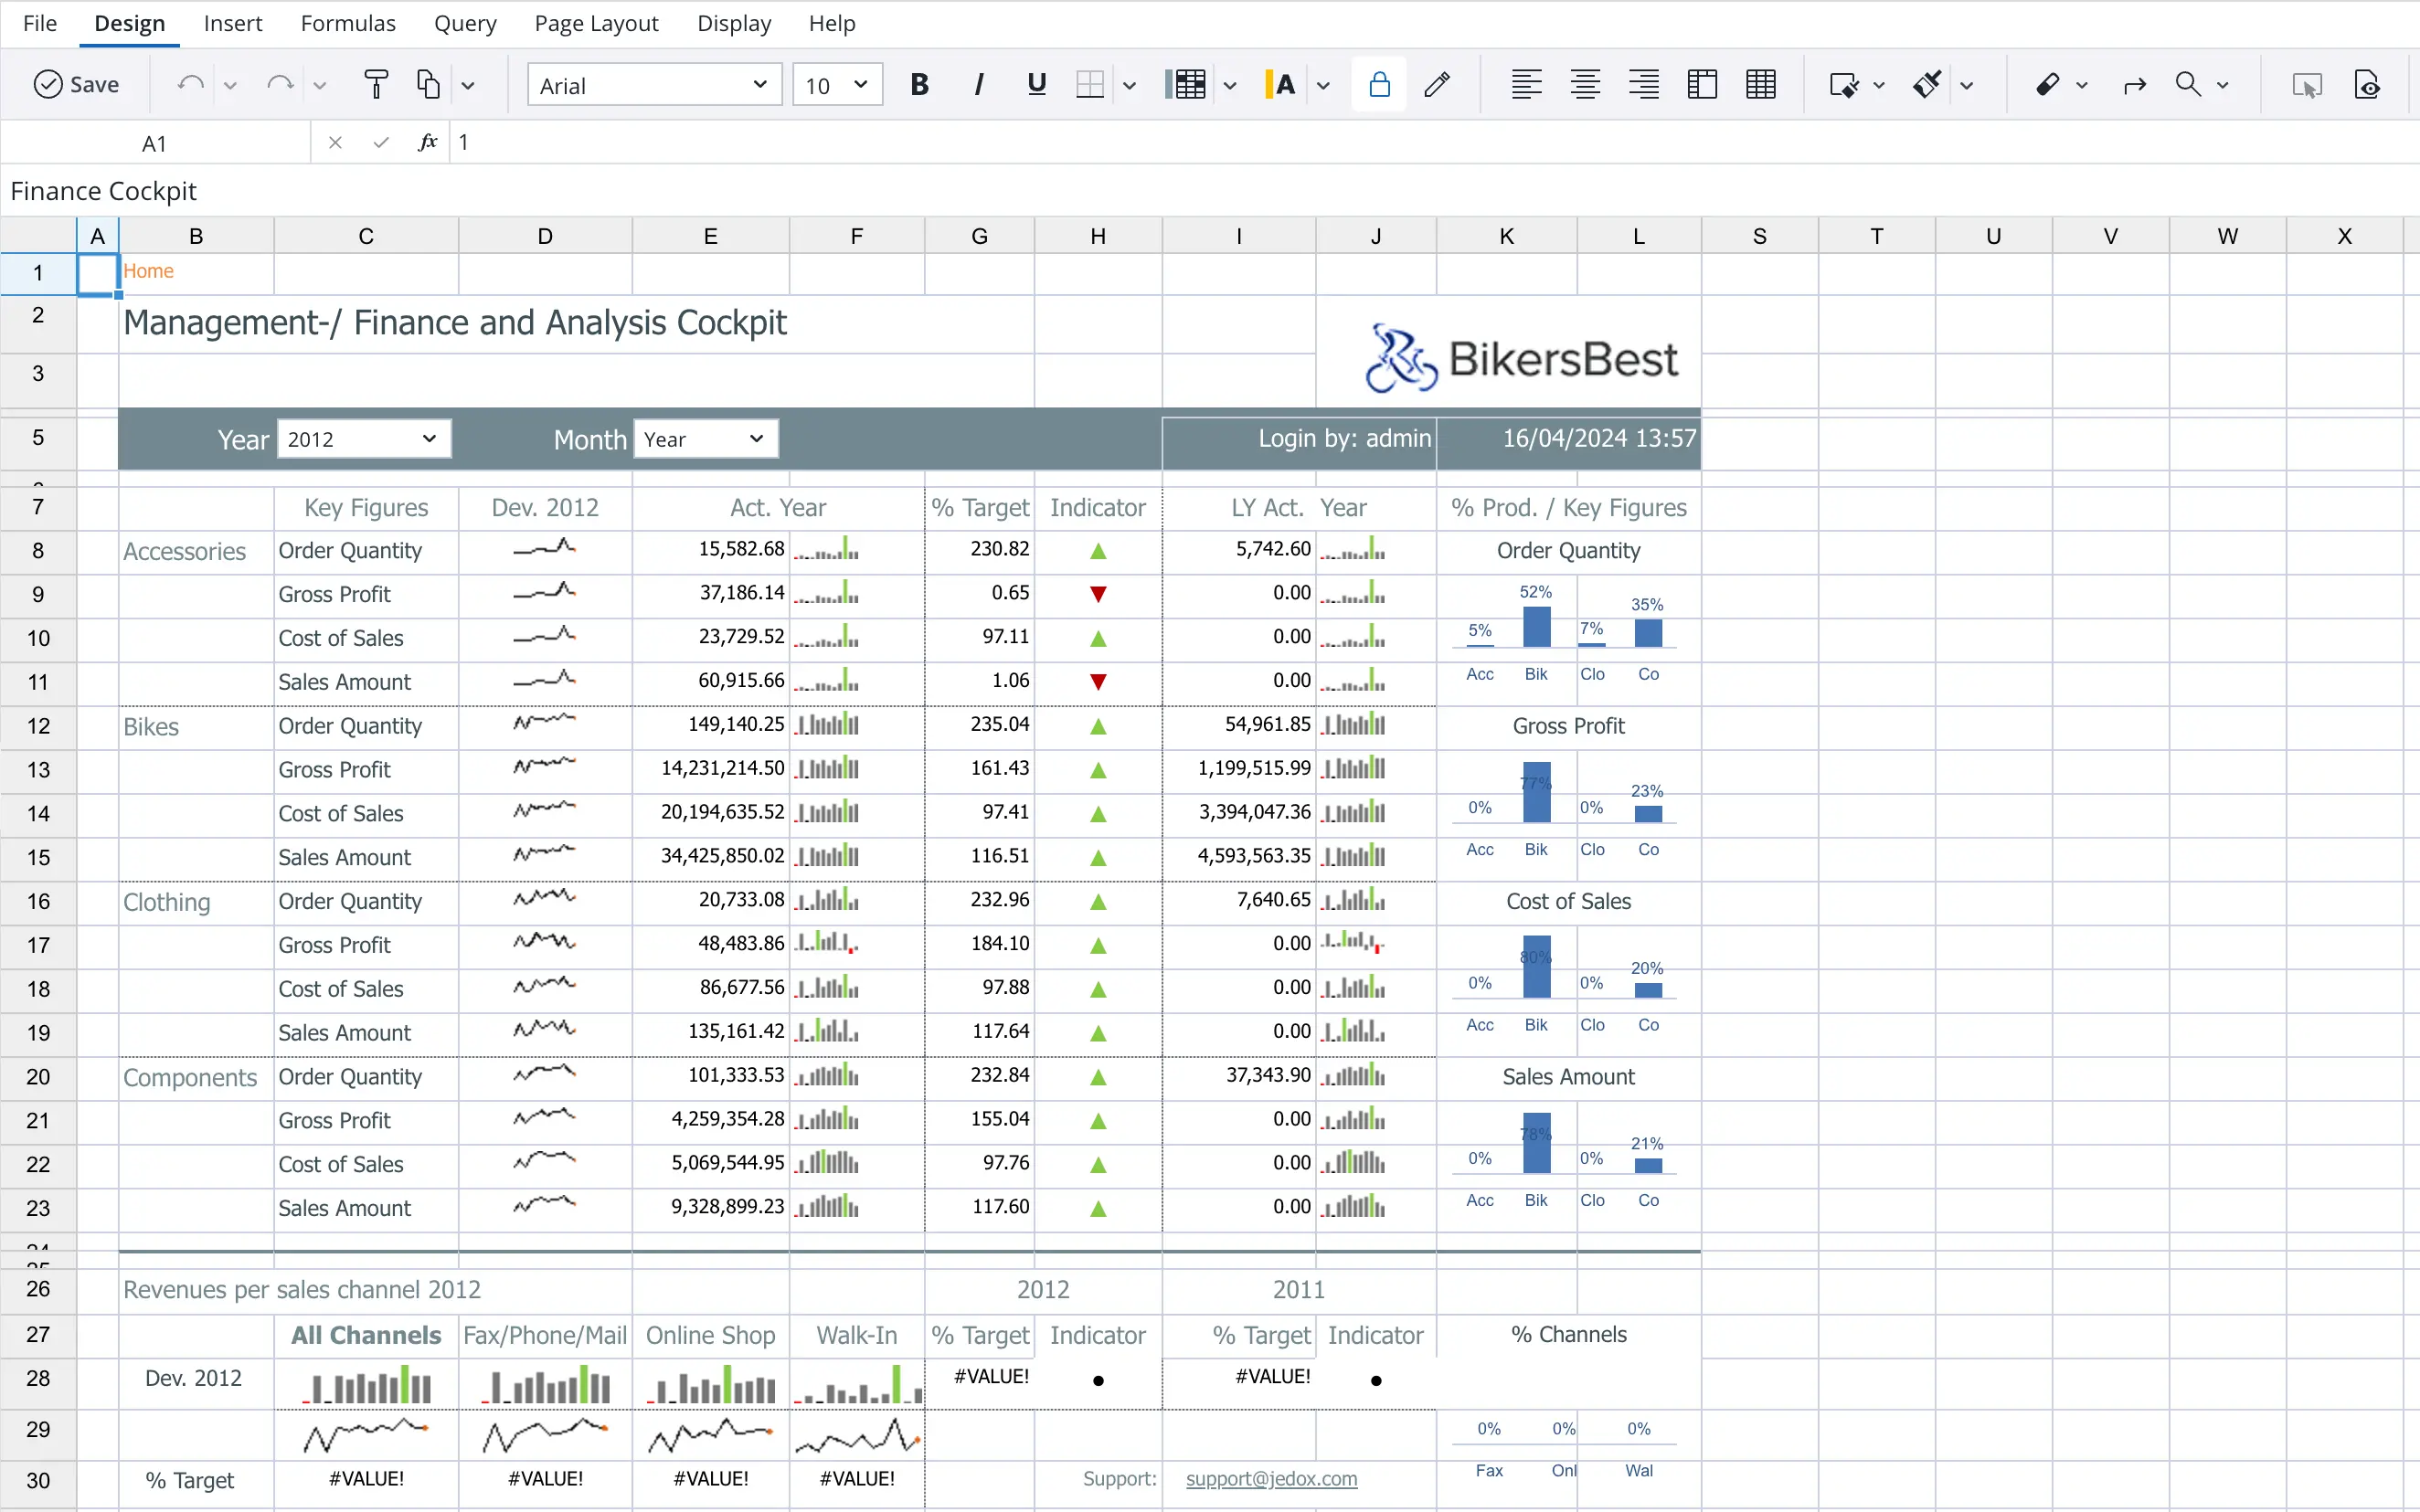
The Spreadsheet Report Designer is a powerful tool that allows users to create and customize reports using familiar online spreadsheet functionality. Users can design reports with a wide range of formatting options, including charts, form elements, widgets, and other visualizations, to present data in a clear and engaging way.
Challenge
The main goal was to provide a seamless experience for users who are already familiar with spreadsheets, to design reports via spreadsheet functionality while also offering powerful and advanced features and capabilities to enhance the reporting process.
Solution
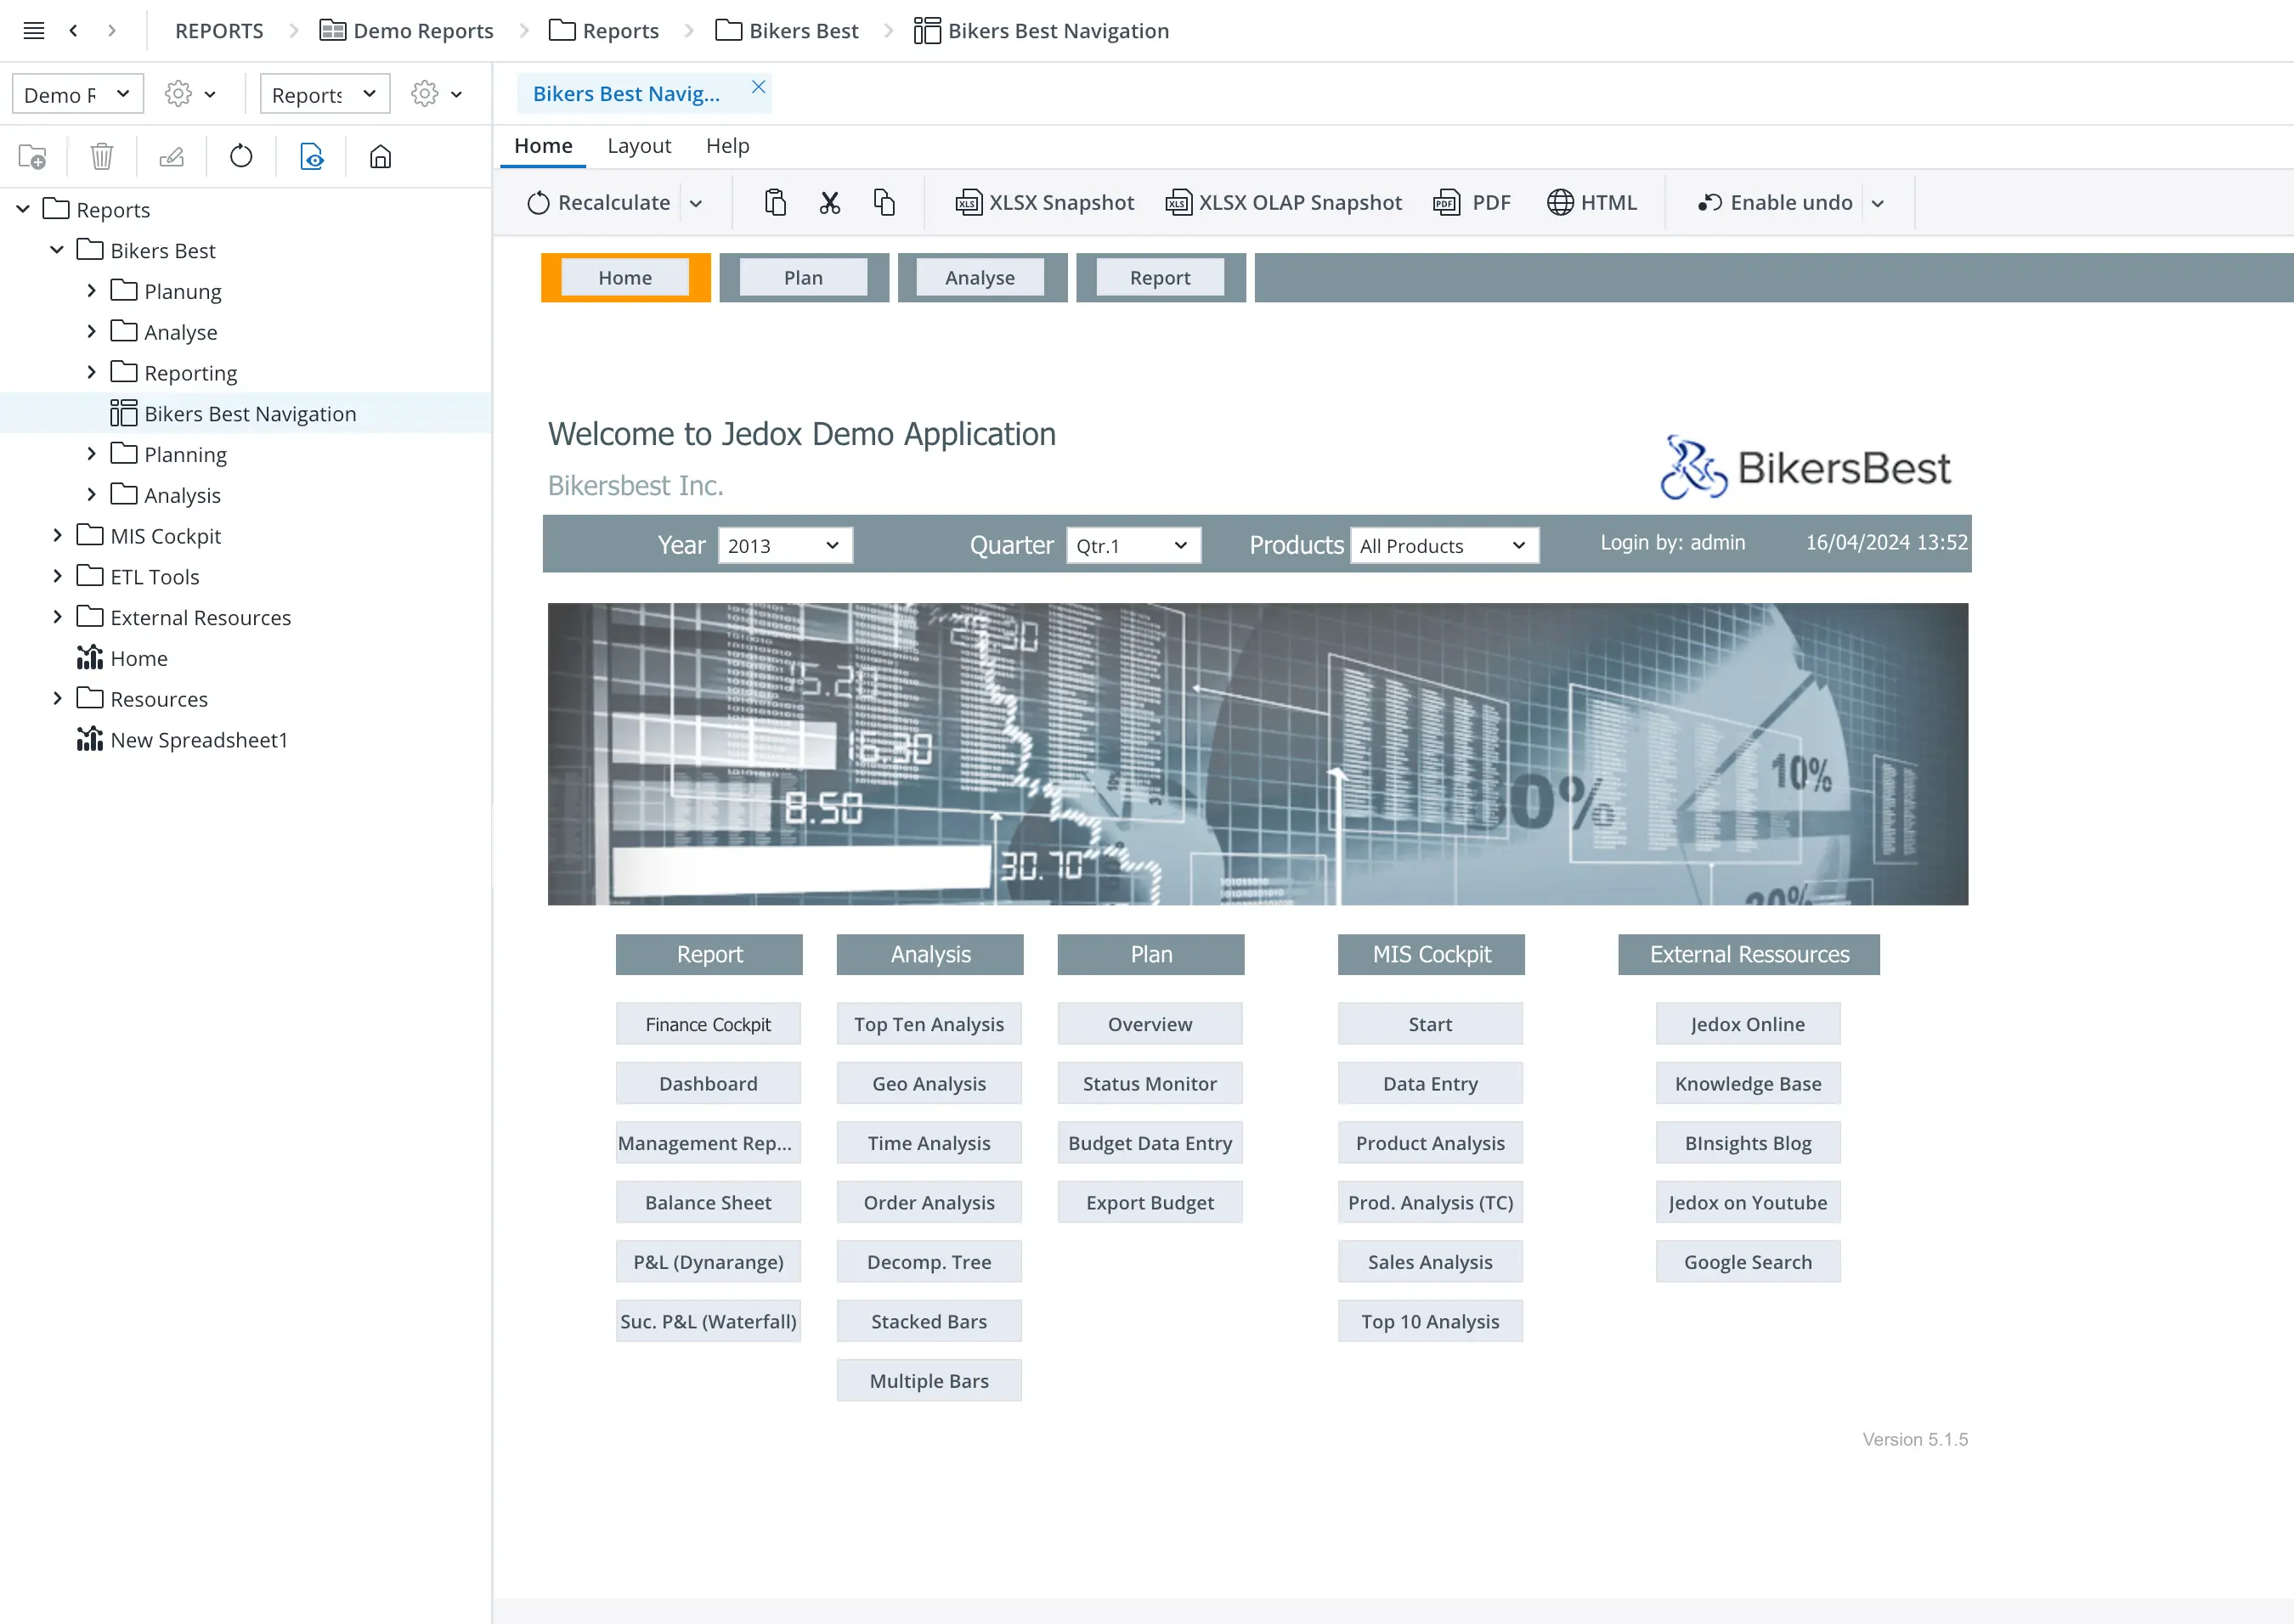
Import/Export
Users can import existing Excel spreadsheets and share them online with selected users. Also, reports created in Spreadsheet Report Designer can be exported in various formats, including PDF, Excel, Excel snapshot and HTML.
Advanced Formatting
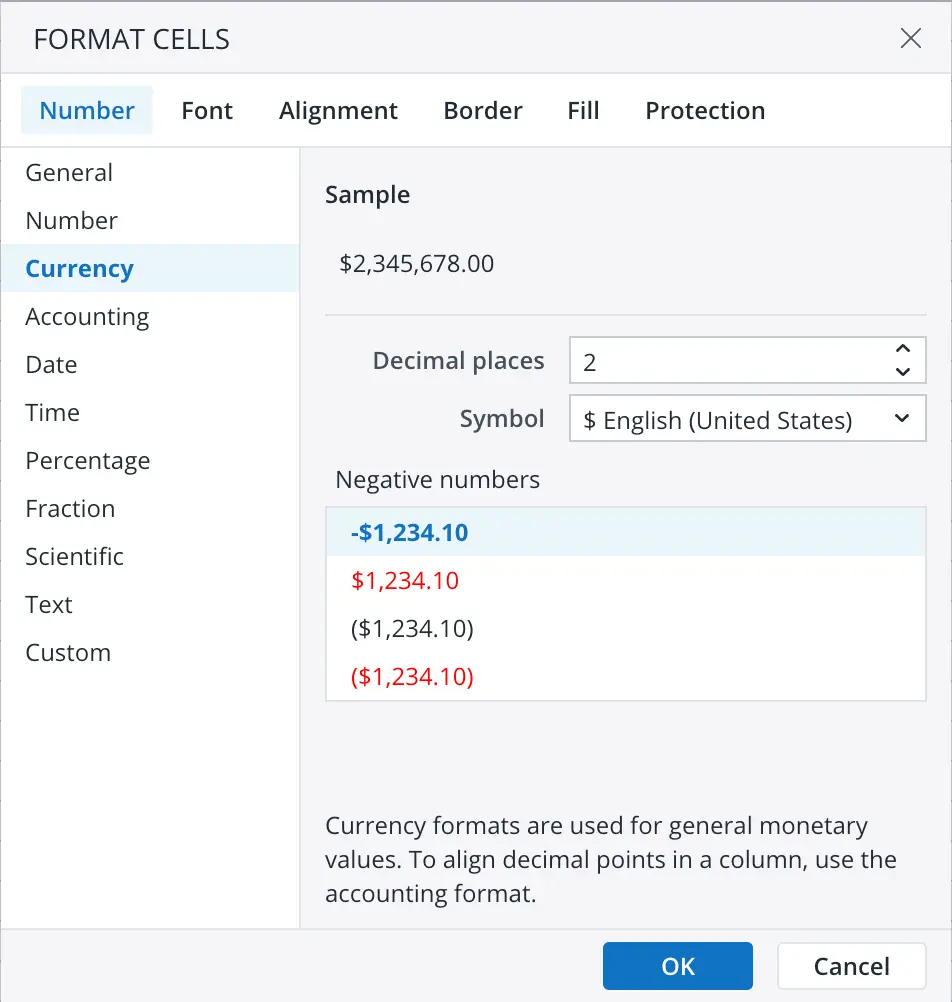
The Spreadsheet Report Designer offers a wide range of
formatting options, such as:
- Number formatting: general, number, currency, accounting,
date, time, percentage, fraction, scientific, text, custom,
etc.
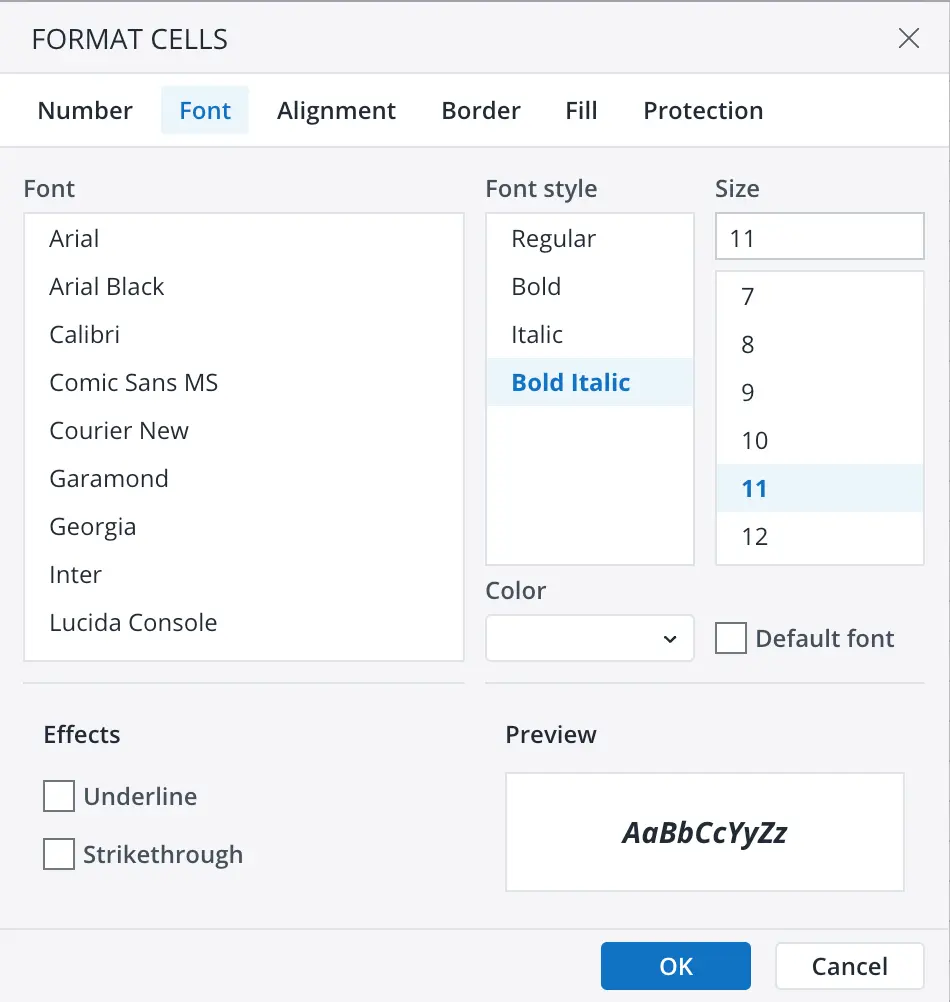
- Font formatting: font, font style, size, color, underline,
strike through, etc.
- Text alignment: horizontal, indent, wrap text, merge
cells, etc.
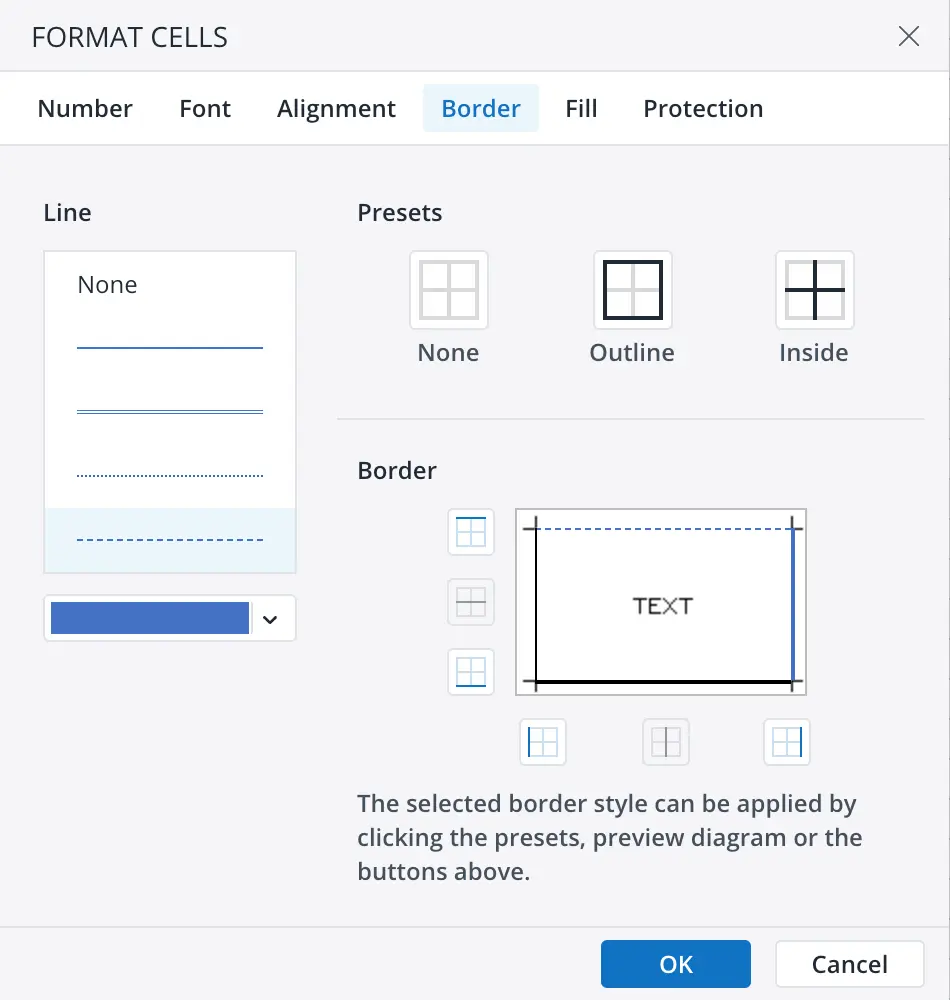
- Cell border formatting: font, font style, size, color,
underline, strike through, etc.
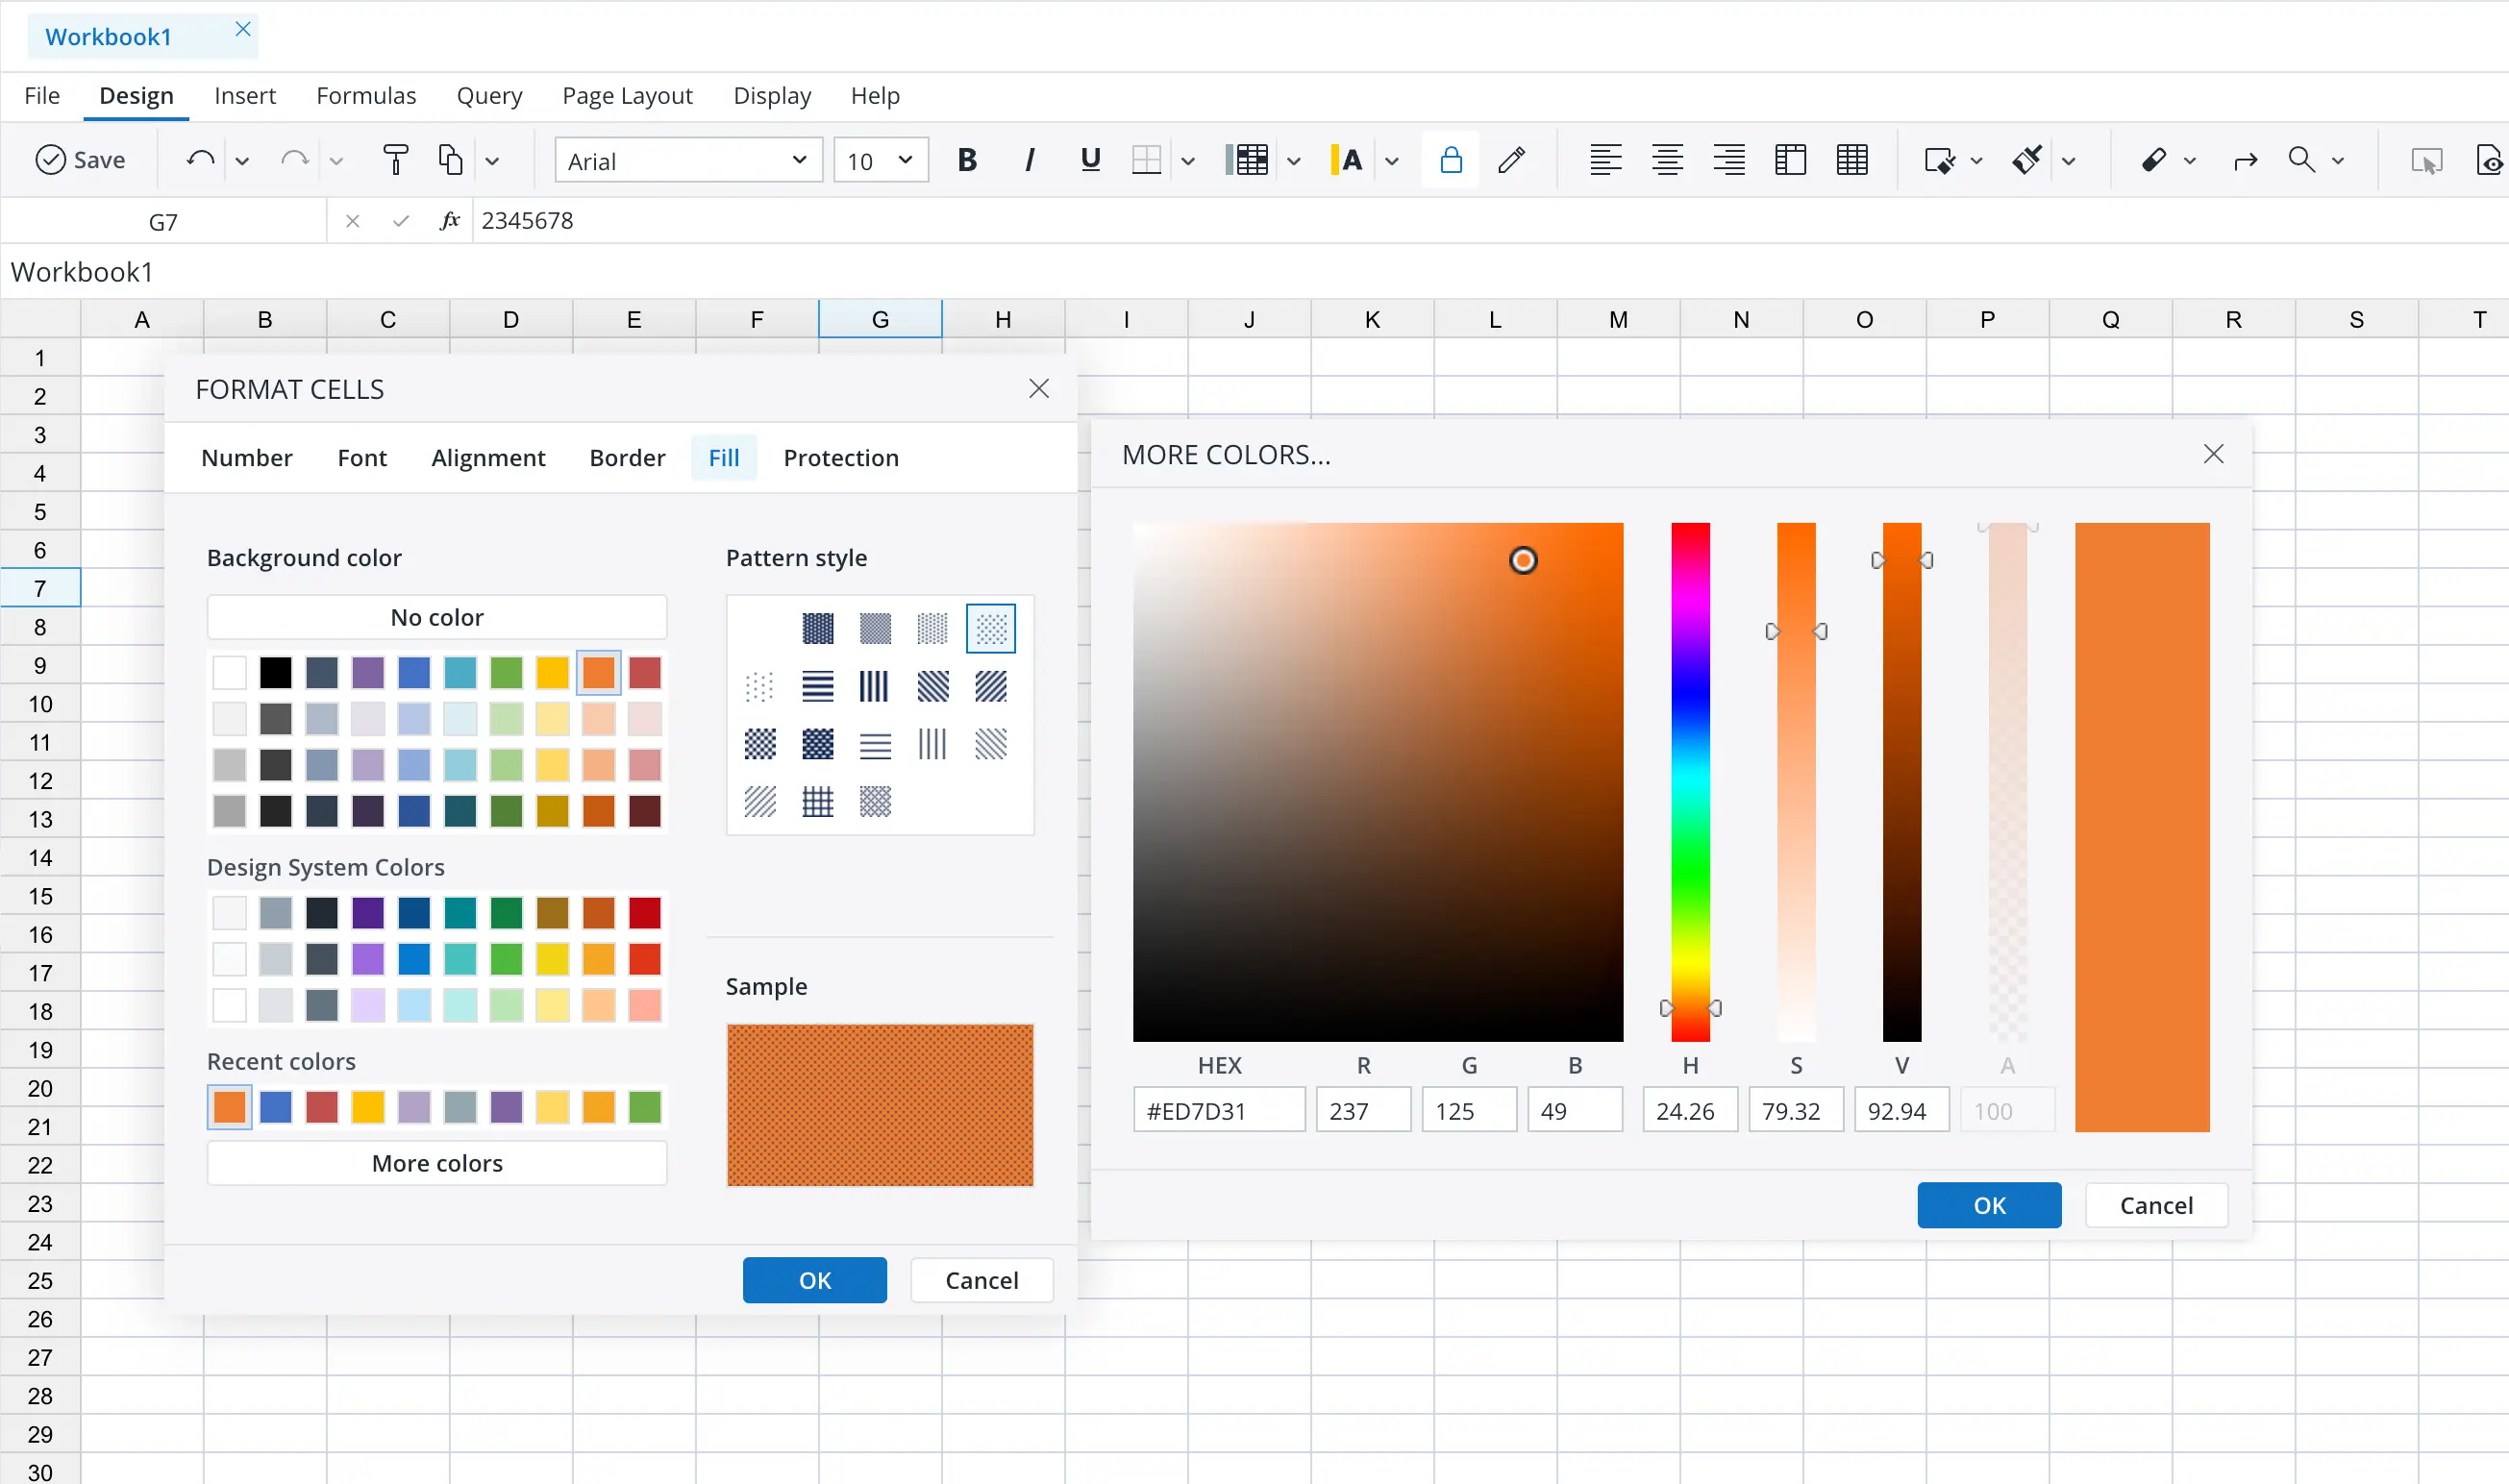
- Cell fill: color, pattern style, etc.
- Cell protection: locking and HTML rendering
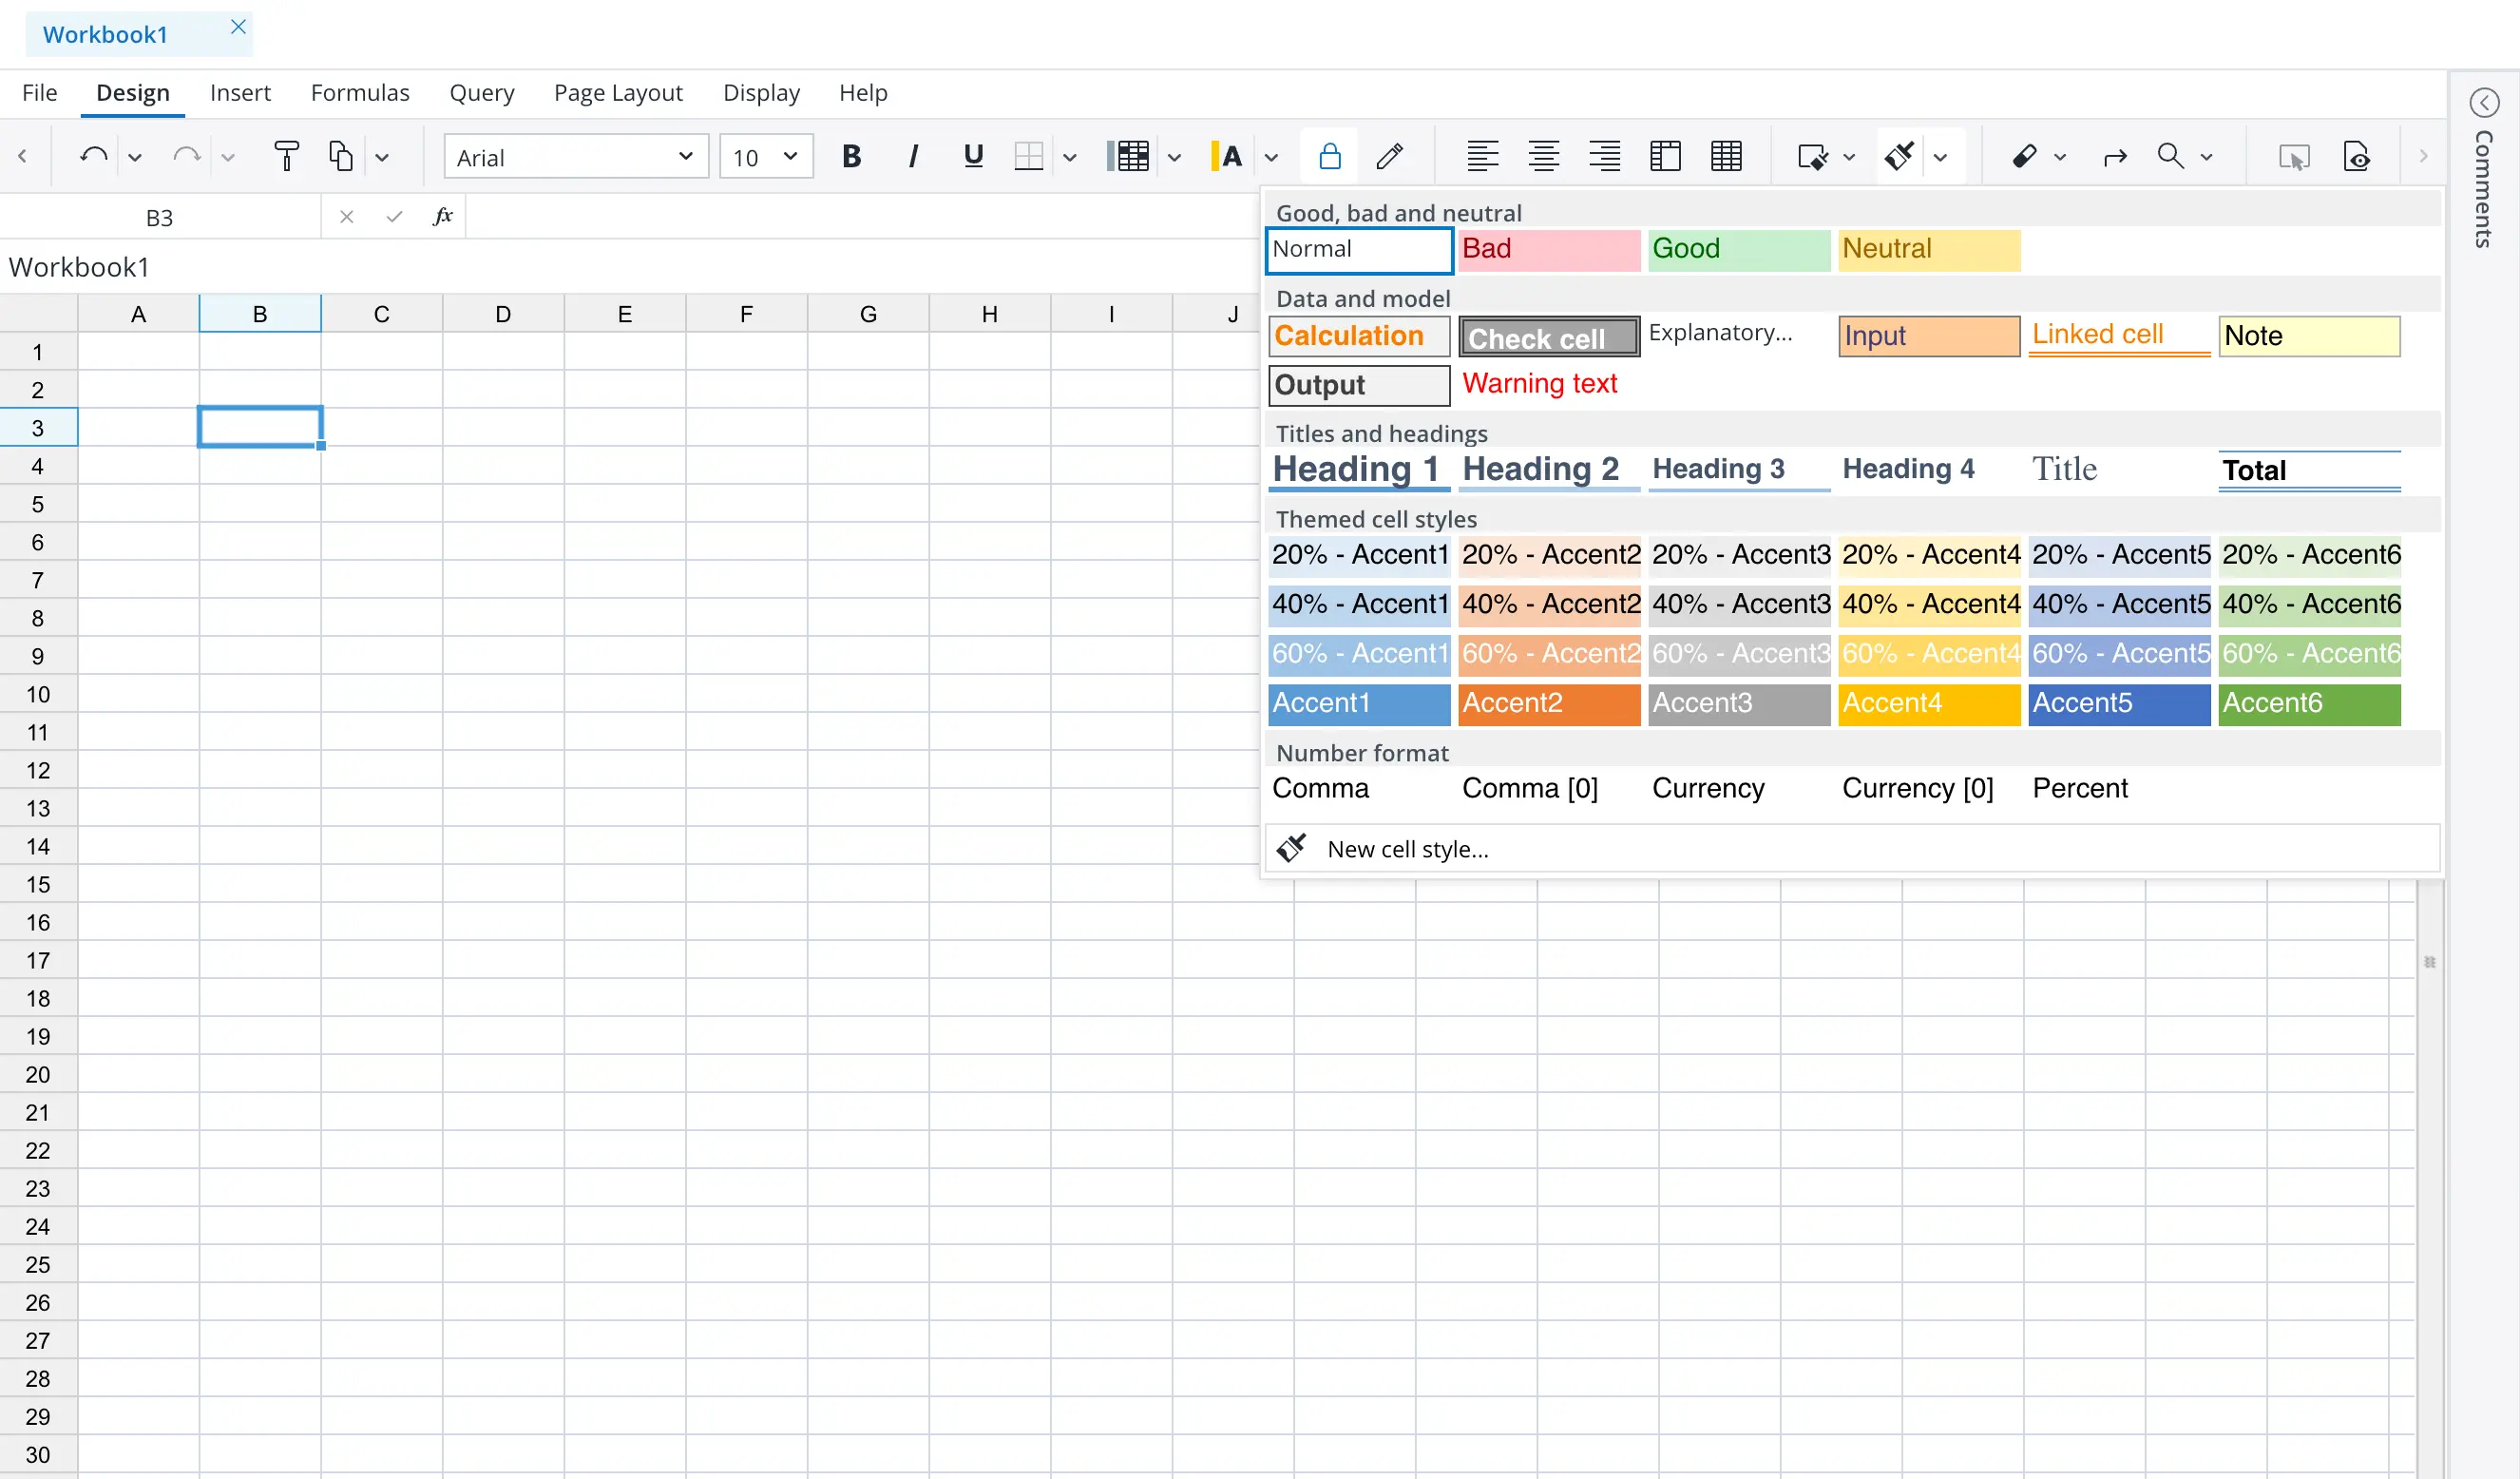
- Cell styles: Users can customize the appearance of
cells by applying different styles, such as font, background
color, border, and alignment. They can also create custom
cell styles and apply them to multiple cells at once.
- Conditional formatting: Users can apply conditional formatting to cells based on specific criteria, such as value, text, date, or formula. They can choose from a wide range of formatting options, including color, font, border, and icon sets.
Spreadsheet Objects
Users can add various objects to reports, such as:
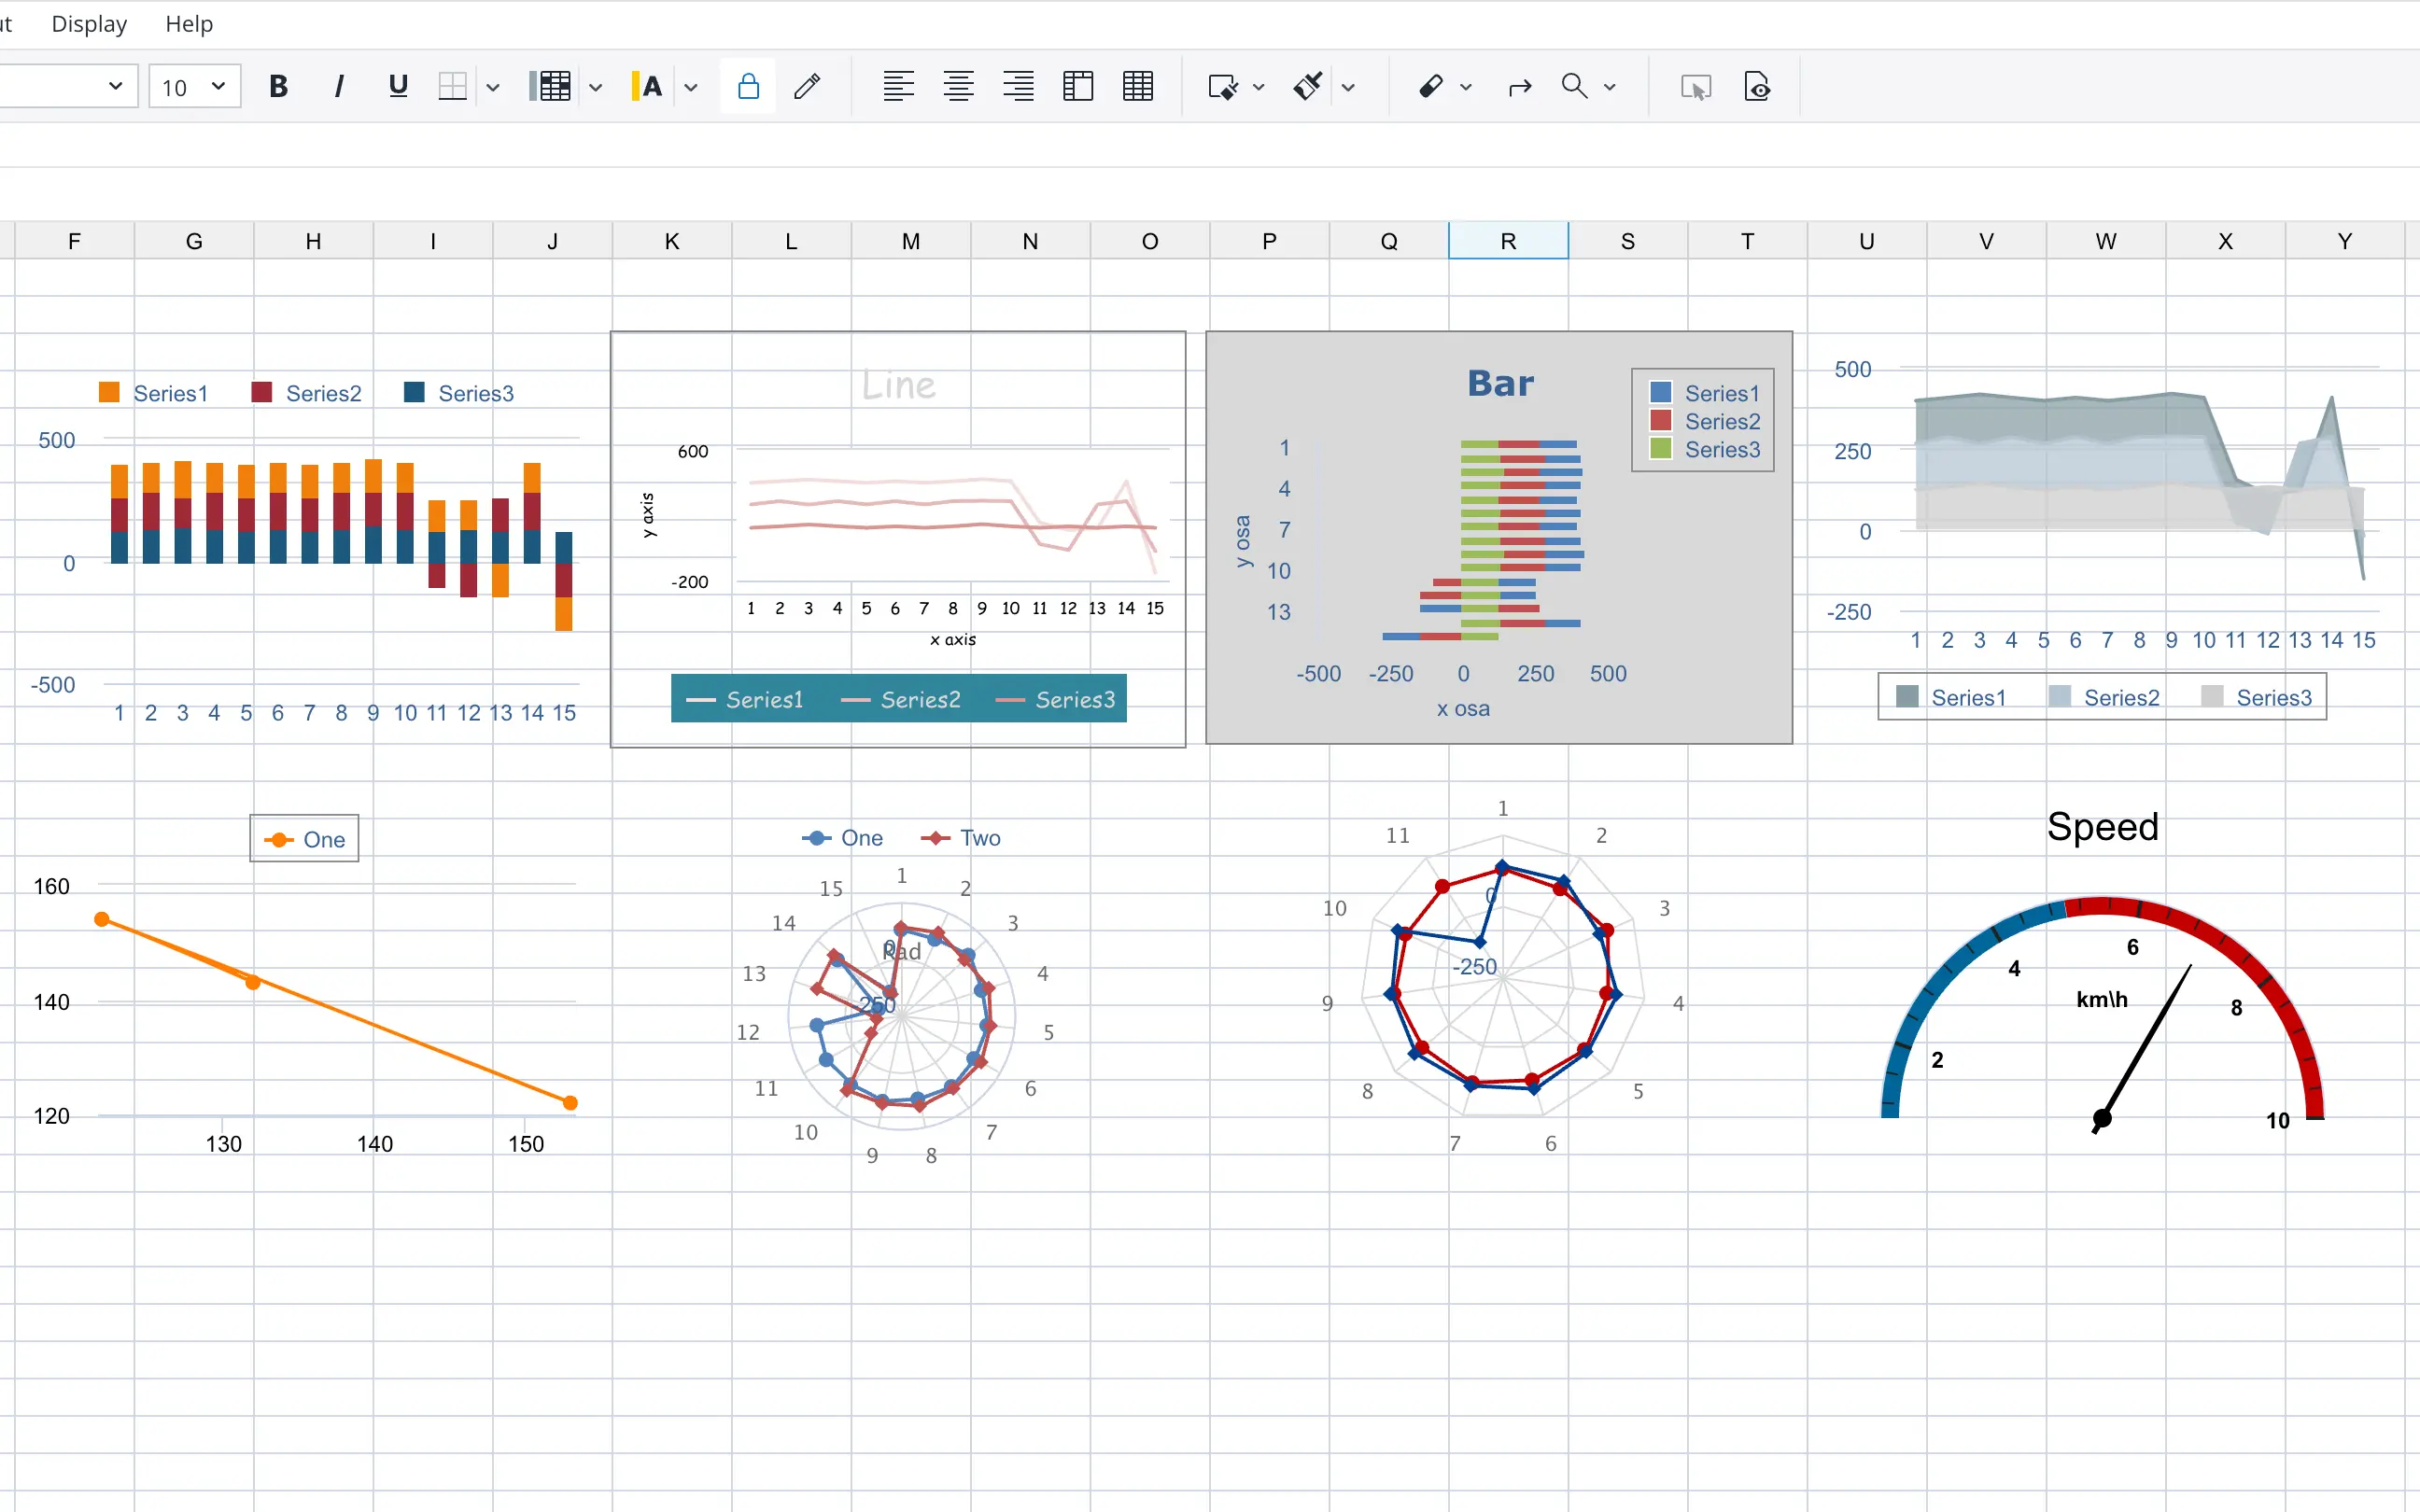
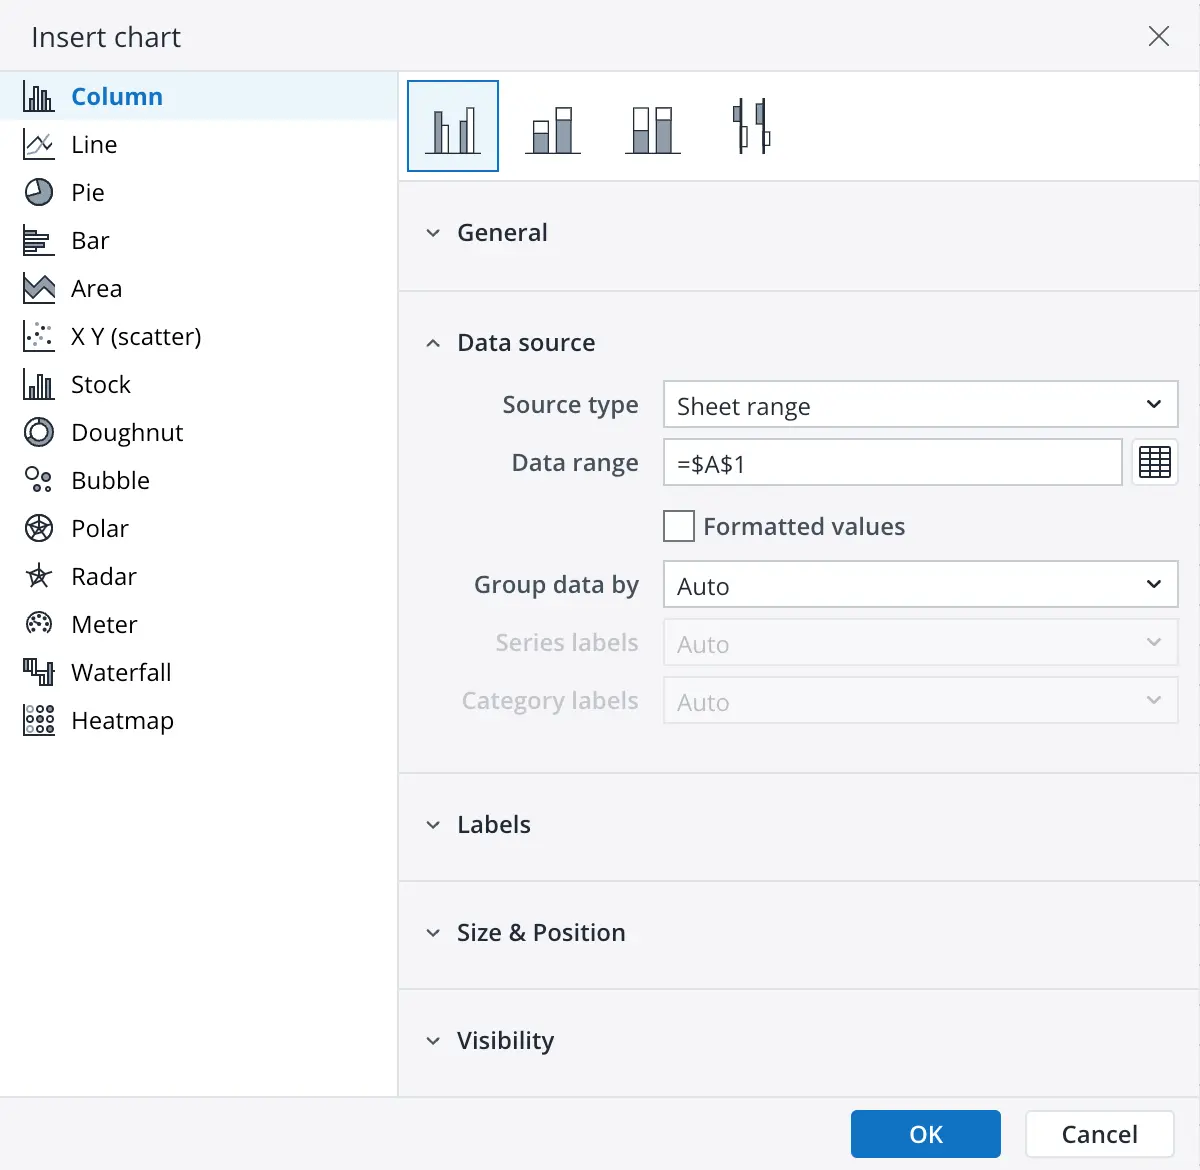
- Charts: Users can create different types of charts,
such as bar, column, line, pie, area, scatter, radar charts,
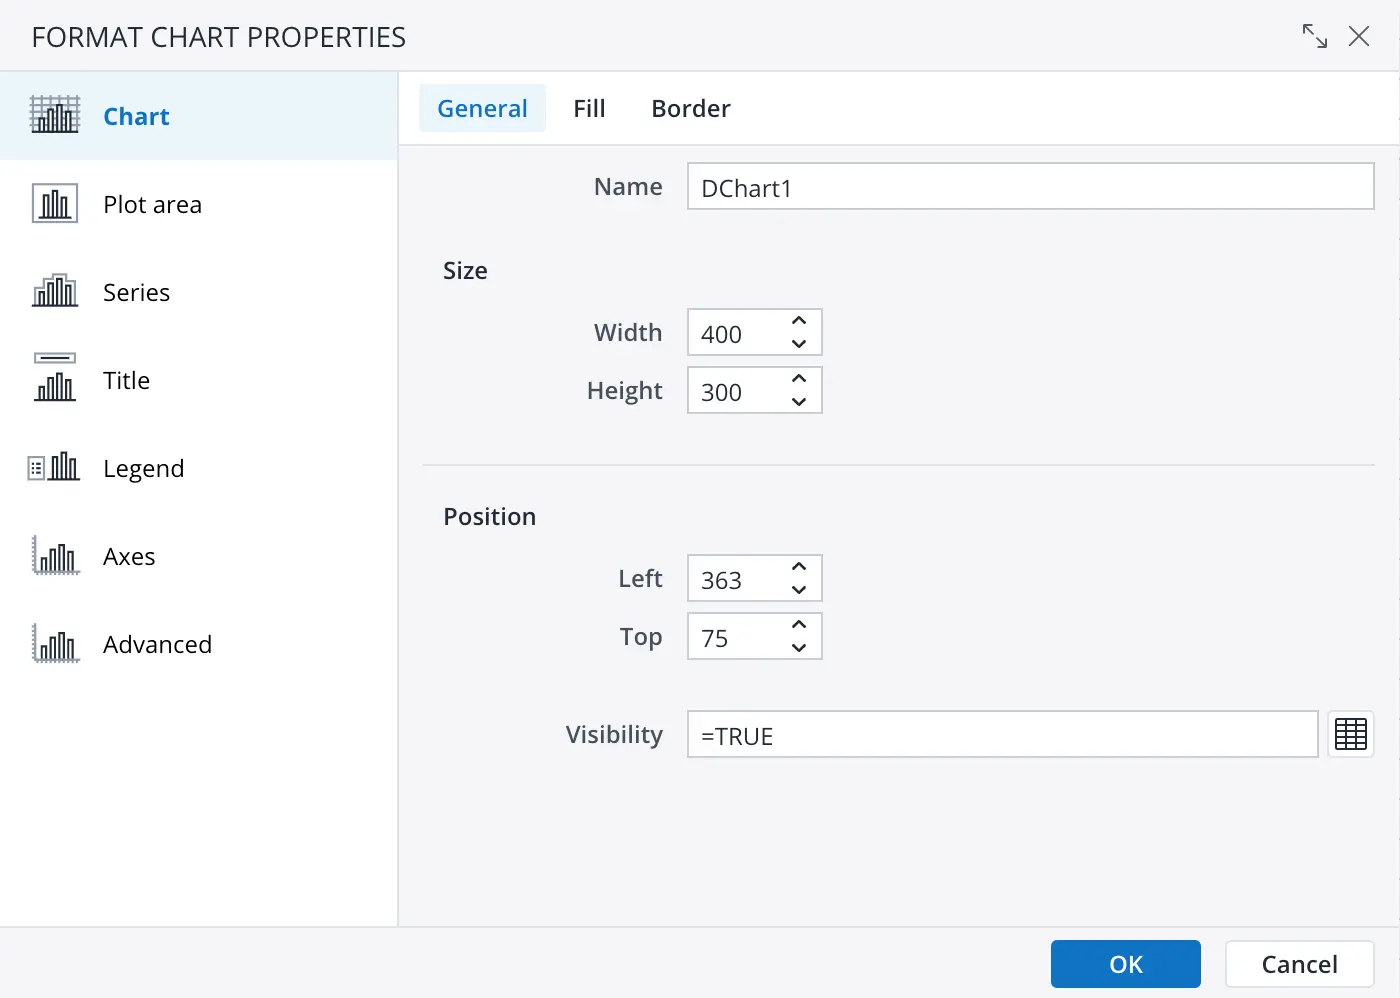
etc. They can customize the appearance of charts by changing
their colors, labels, legends, and other properties.
- Success charts: Success charts visualize the progress
towards a goal or target. Users can customize the appearance
of success charts by changing their colors, labels, legends,
and other properties.
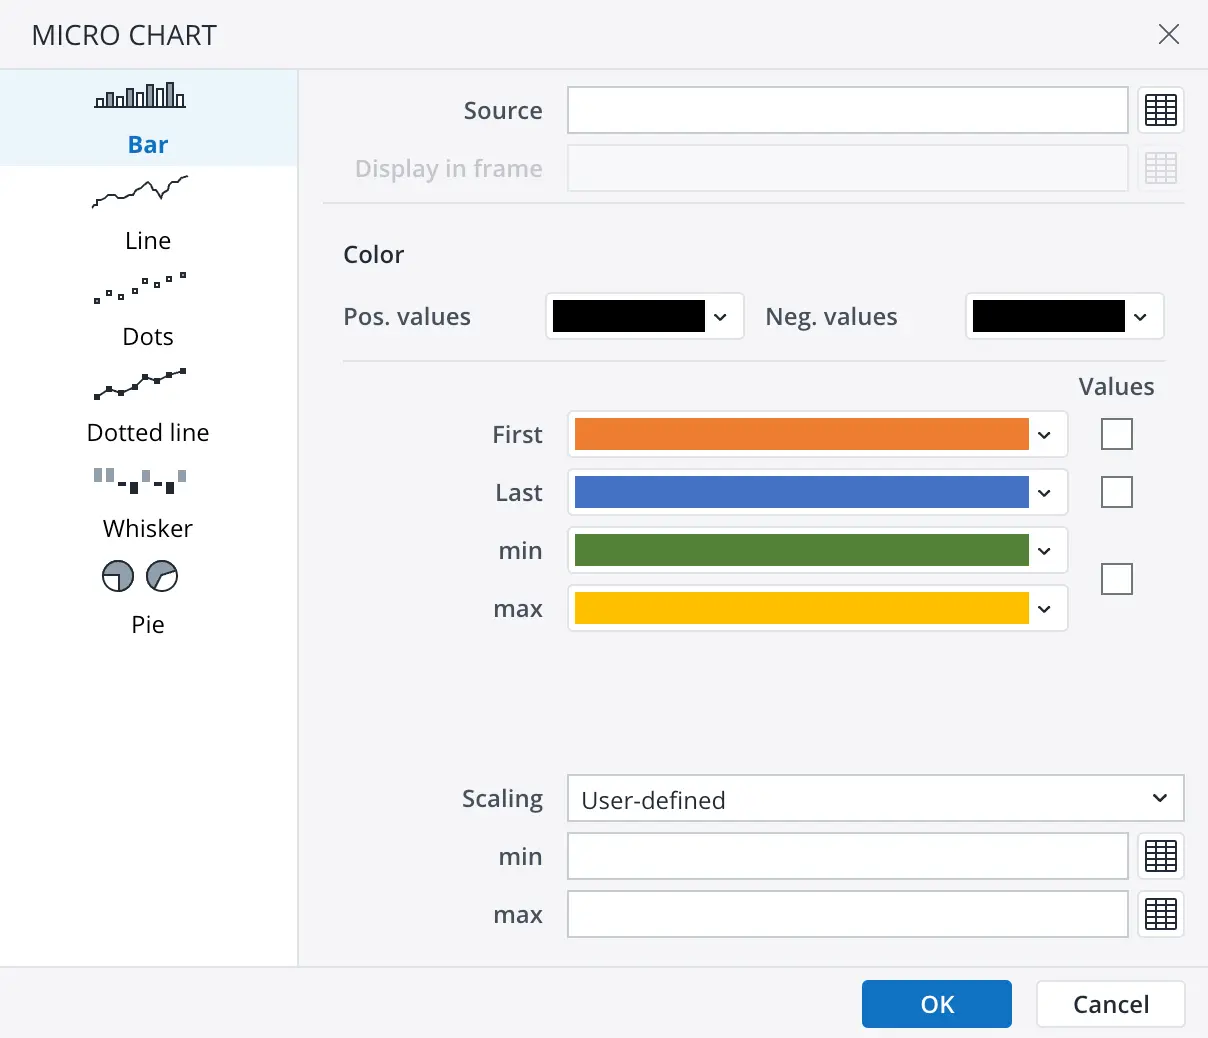
- Micro charts: In-cell charts visualize data directly in the spreadsheet cells. They can choose from a wide range of chart types, such as bar, line, dots, dotted line, whisker, pie, etc.
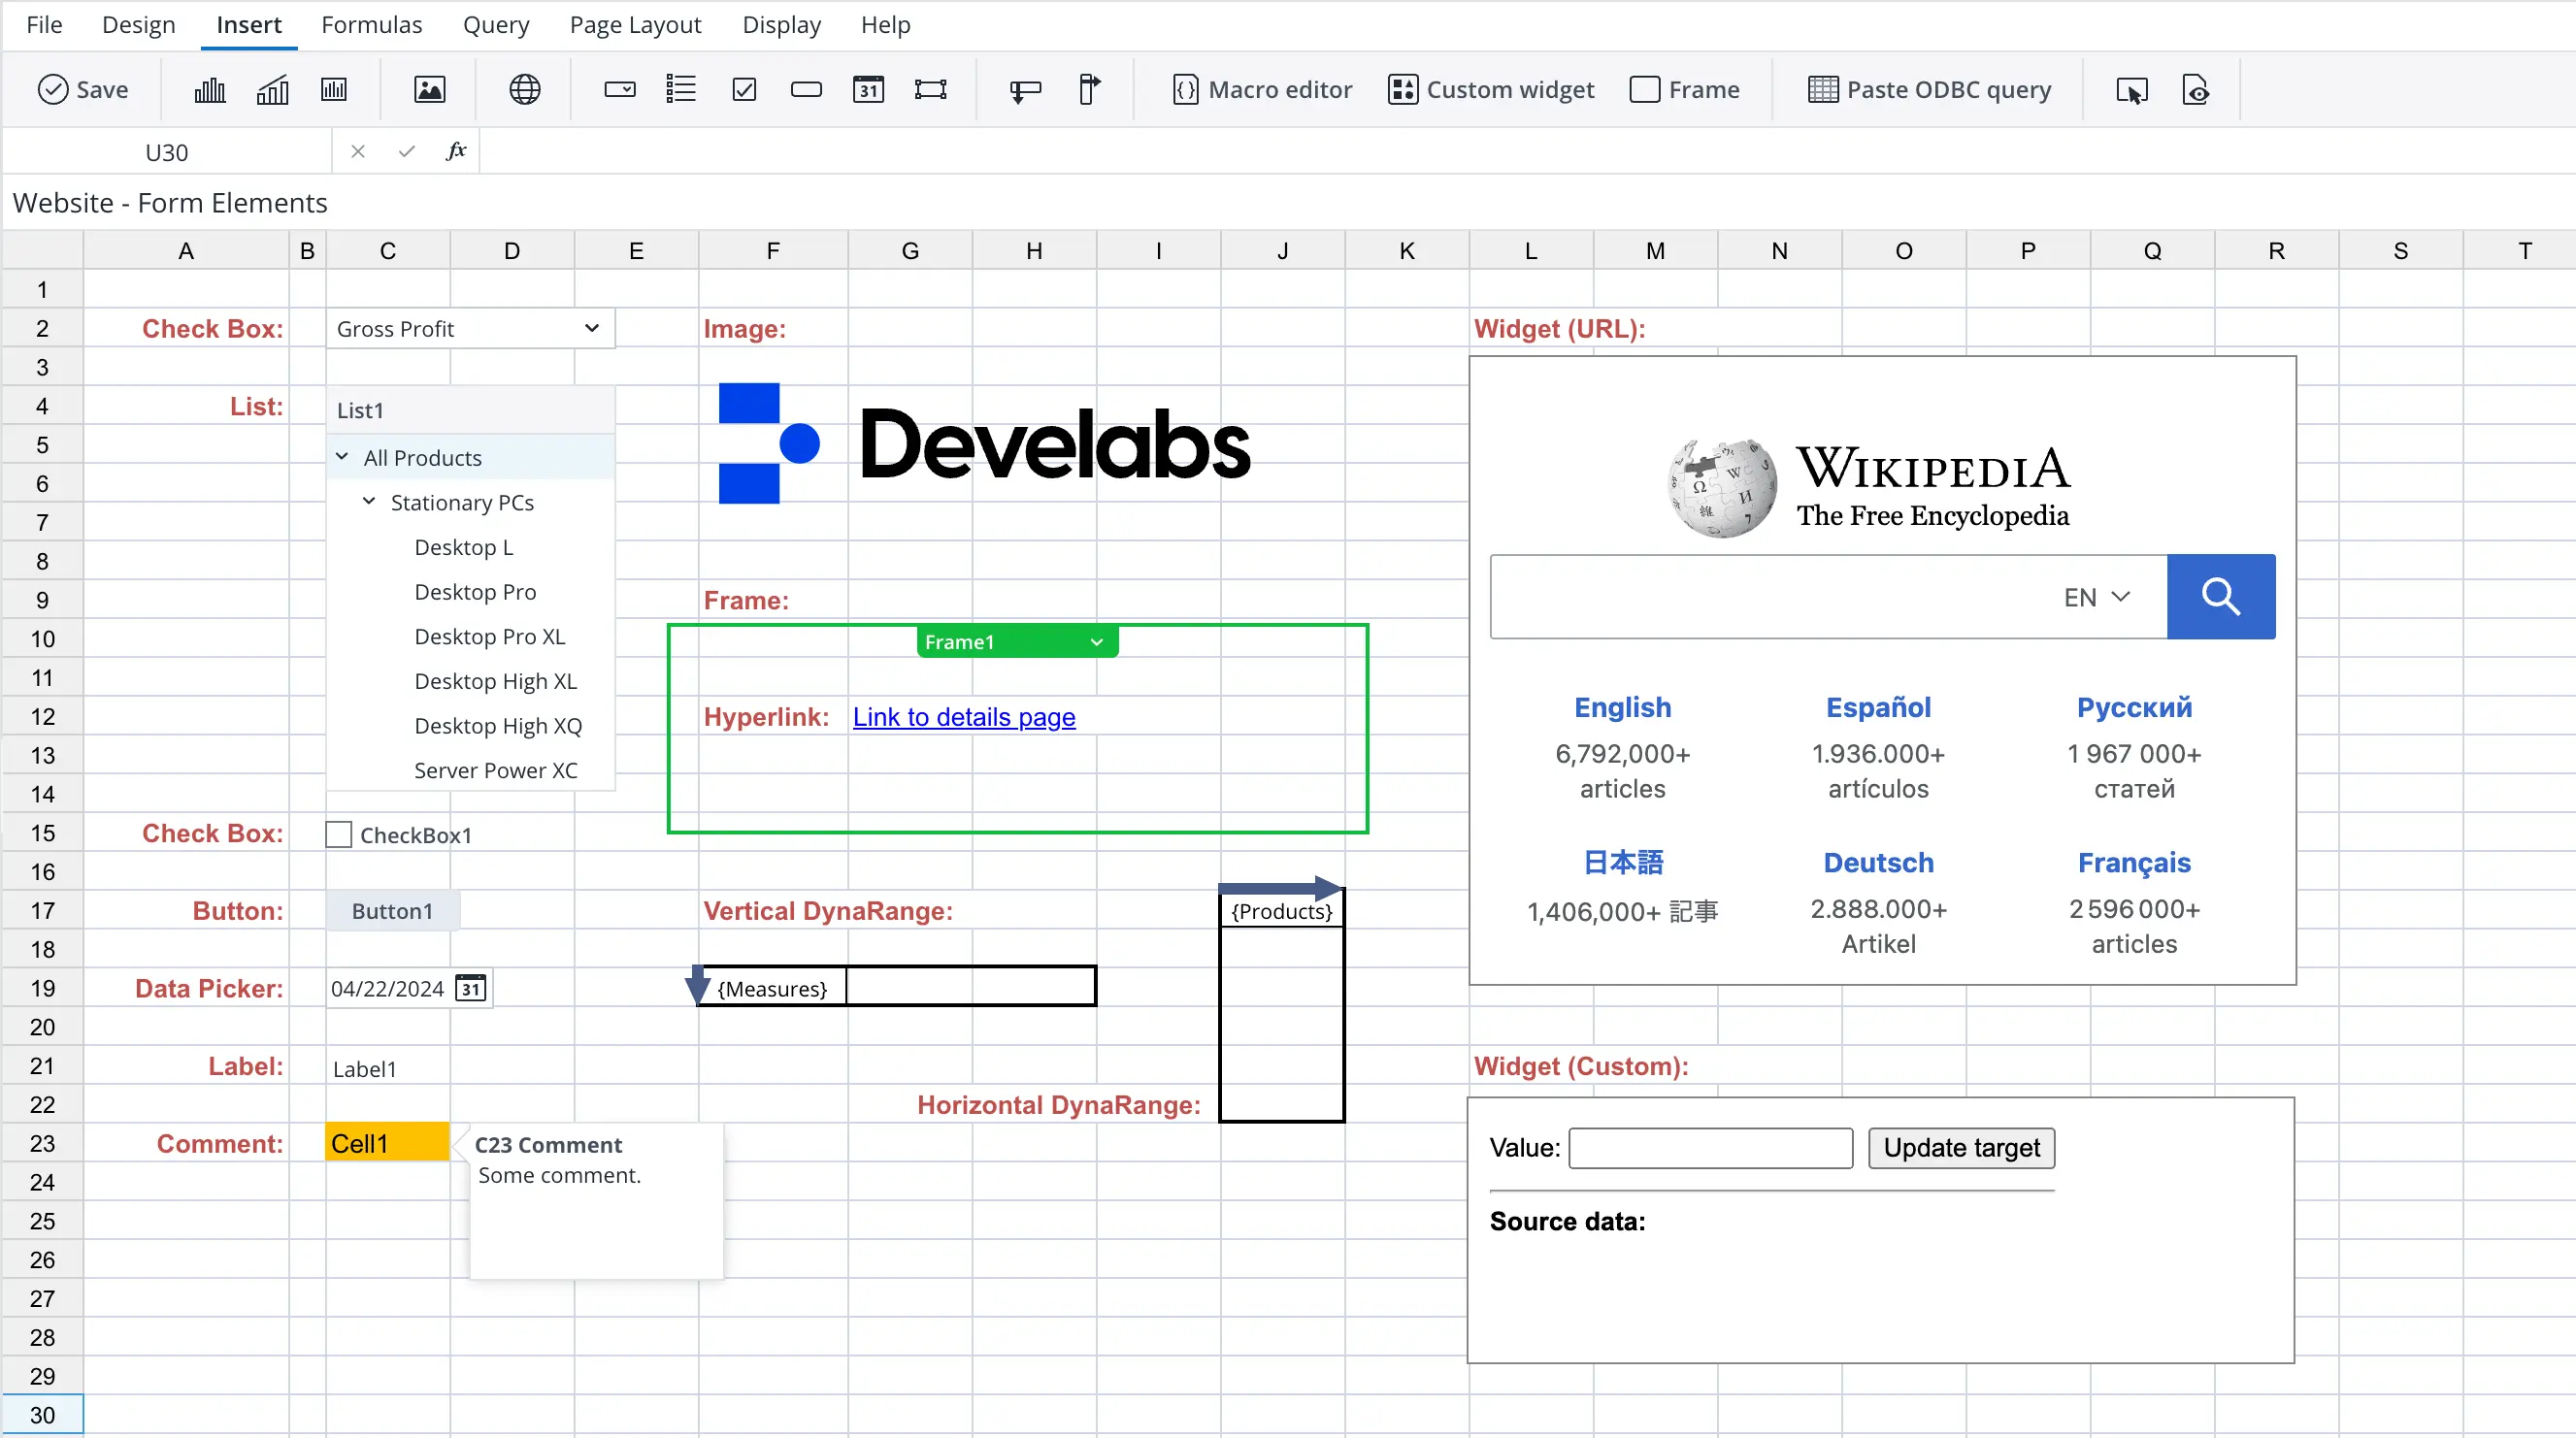
- Form elements: Using form elements, users can create
interactive reports with dropdown lists, lists, check boxes,
buttons, date pickers, labels, images, etc. They can customize
the appearance of form elements by changing their size, position,
and style.
- Widgets: Containers for third-party content such as
web pages, images, videos, and other widgets. Users can embed
widgets in reports to display additional information or interactive
content. They can also contain custom-made web applications
having two-way communication with the report.
- DynaRanges: Dynamic ranges that automatically adjust
their size based on the number of rows and columns in the chosen dynamic data source.
Users can create DynaRanges to reference data in reports
and update them automatically when the data changes.
- Comments: Enrich cells by providing additional information or context by always visible or hoverable balloons. Users can add comments to cells to explain the data, provide instructions, or add notes.
Hyperlinks, Actions and Macros
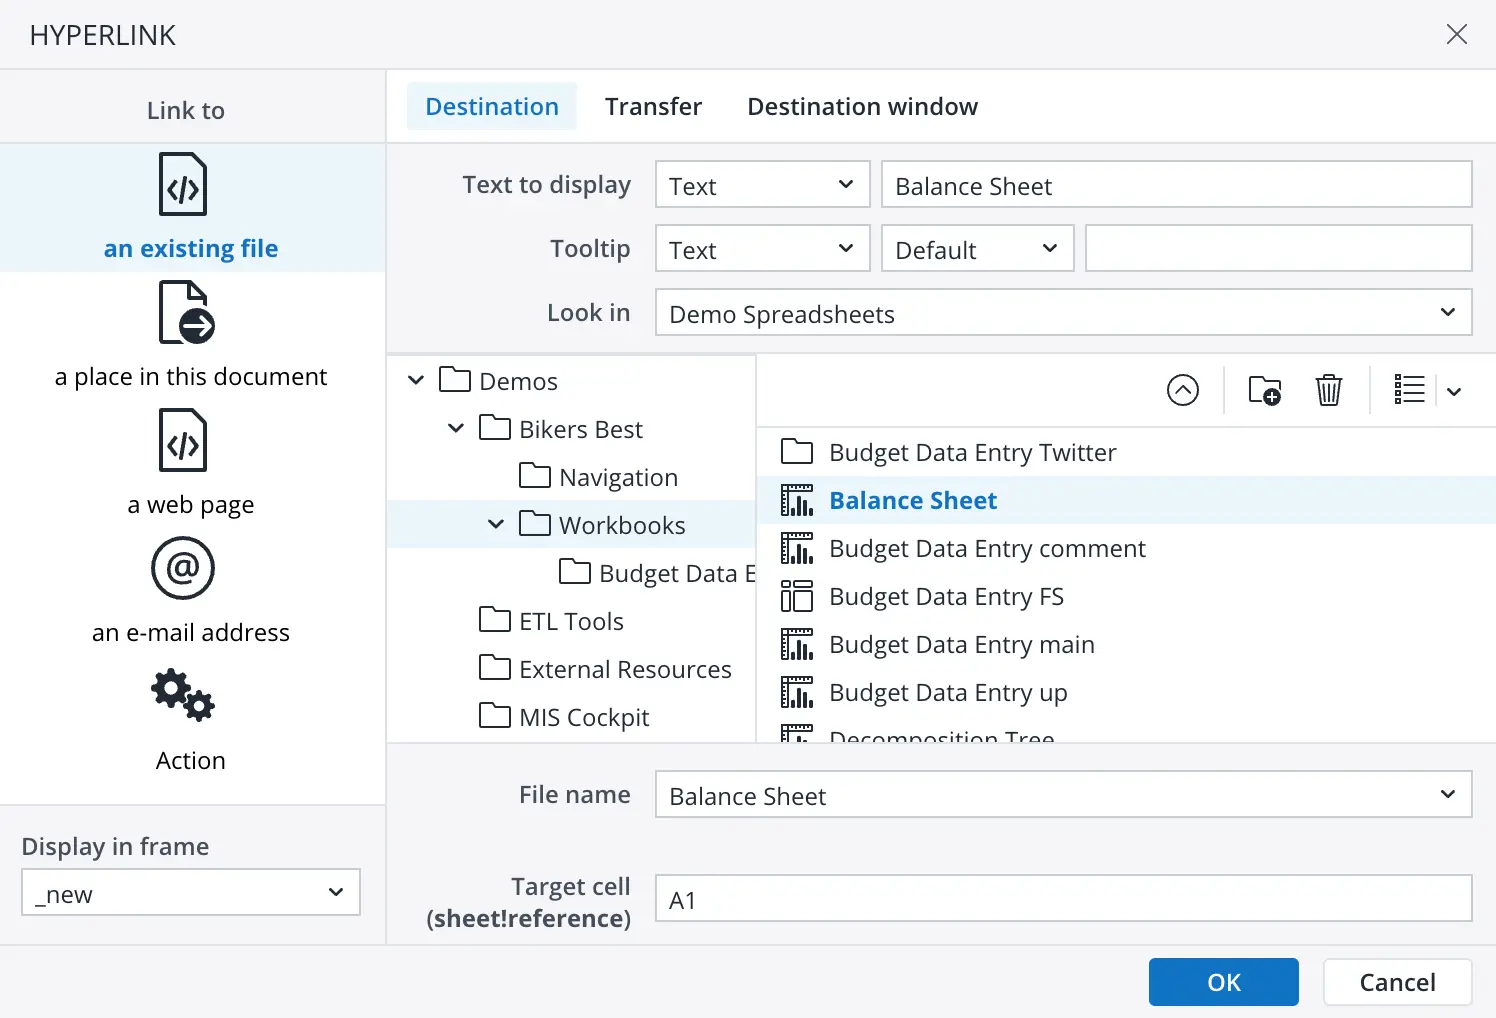
Users can add hyperlinks to reports to navigate to other
reports, web pages, or external resources.
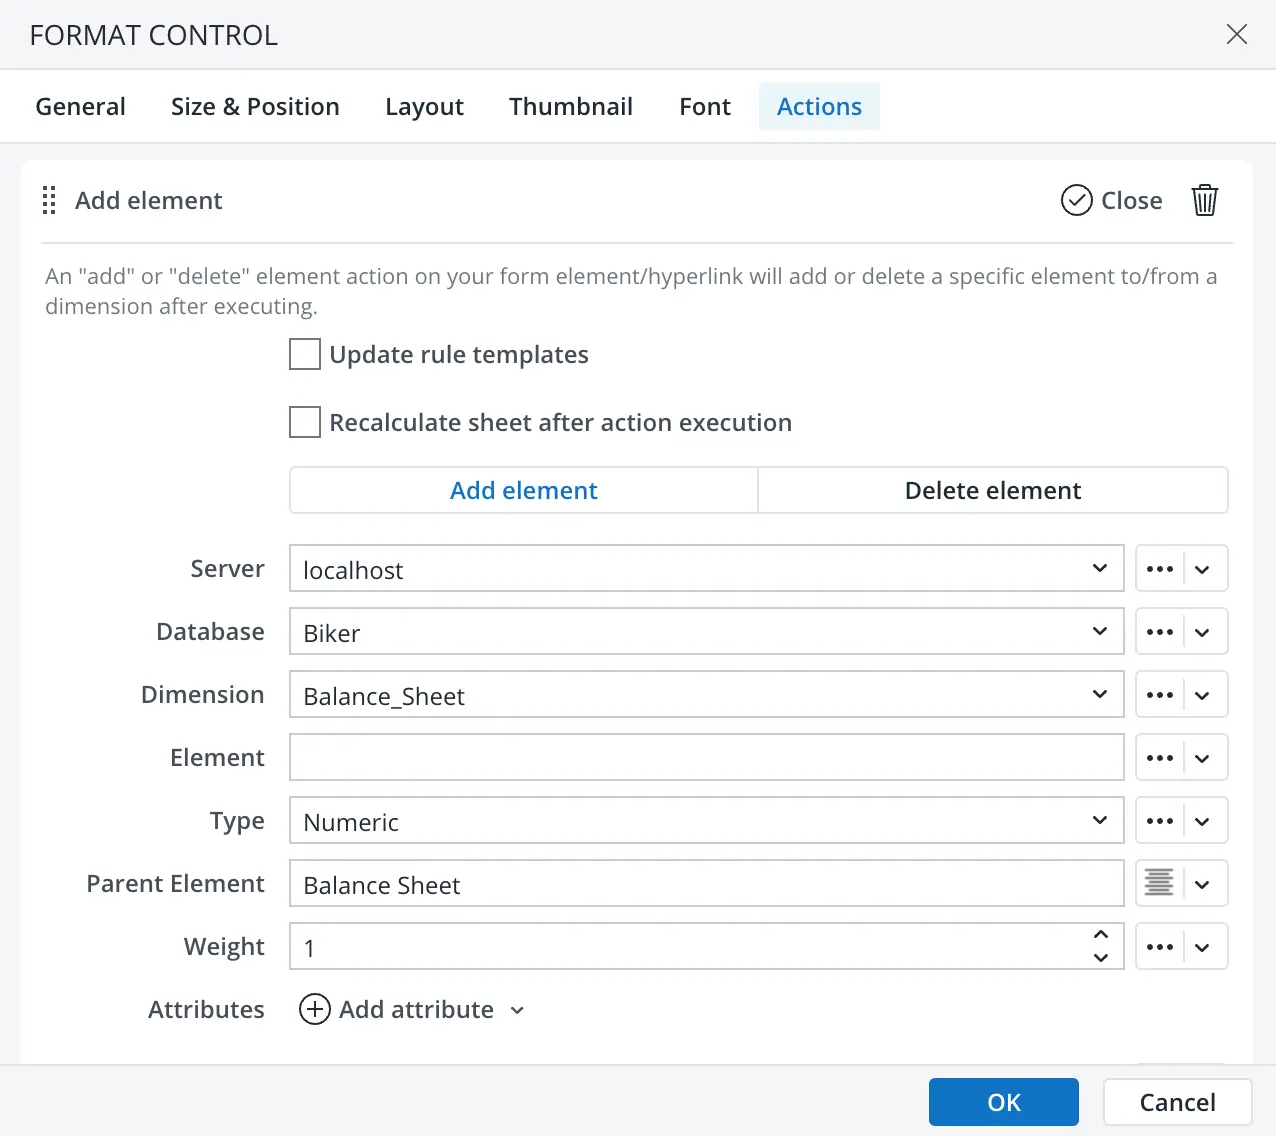
They can also create actions to perform specific tasks, such
as add/delete database elements, close report, download/upload reports
or files, select database elements, export report, follow hyperlink, execute
ETL operations, logout user, read/write database cell value,
recalculate sheet data, run scheduler task, send email and set
value in a report.
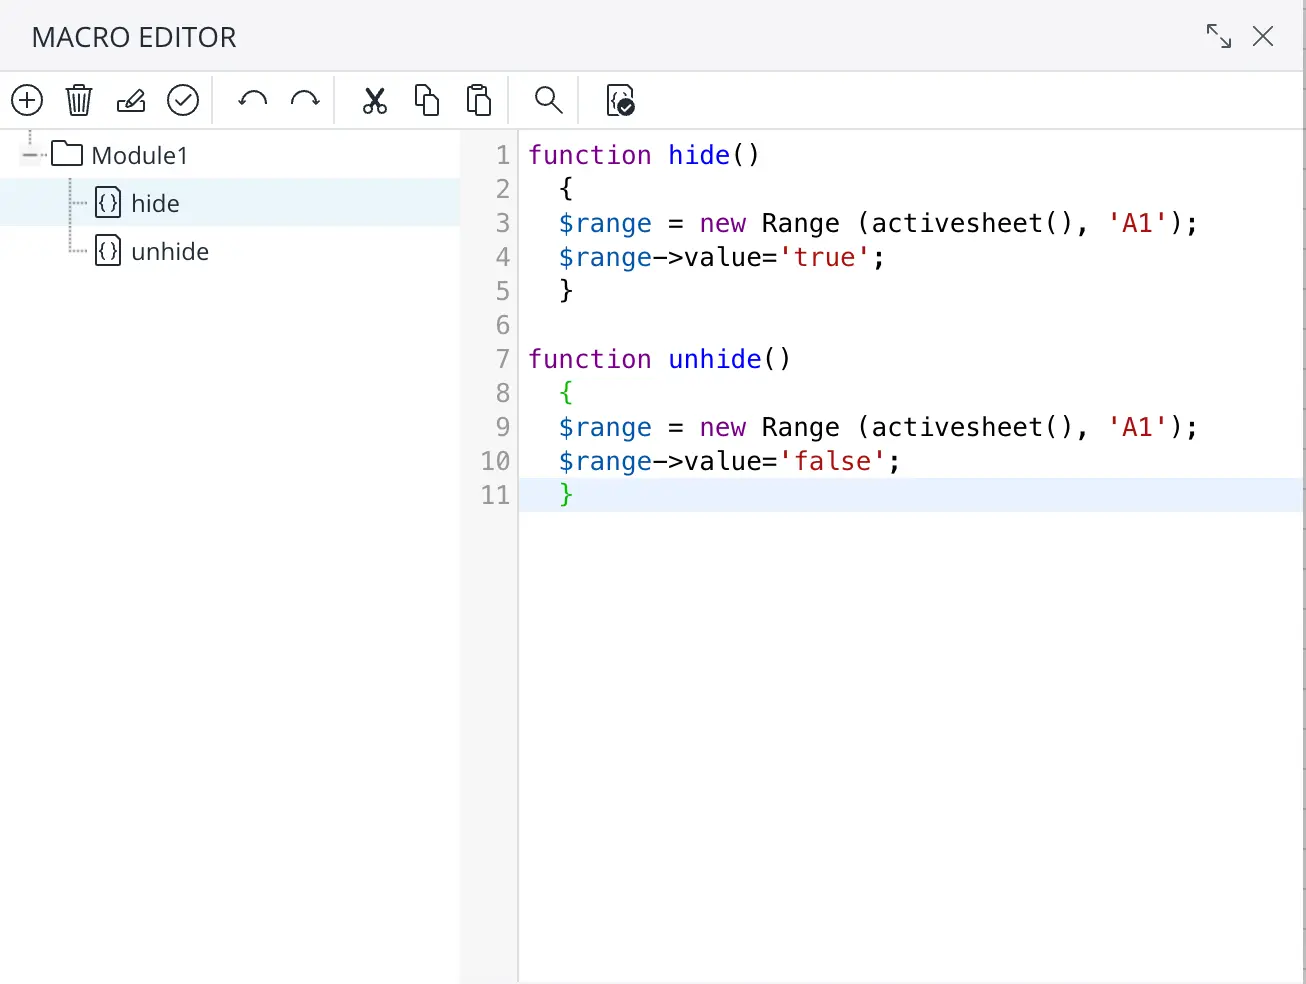
Macros are custom scripts that automate repetitive tasks and
enhance the functionality of reports. Users can create macros
to perform complex calculations, data manipulations, and other
operations in reports.
Data Calculation
During the report creation process, the designer has at his
disposal advanced options for calculating data, such as:
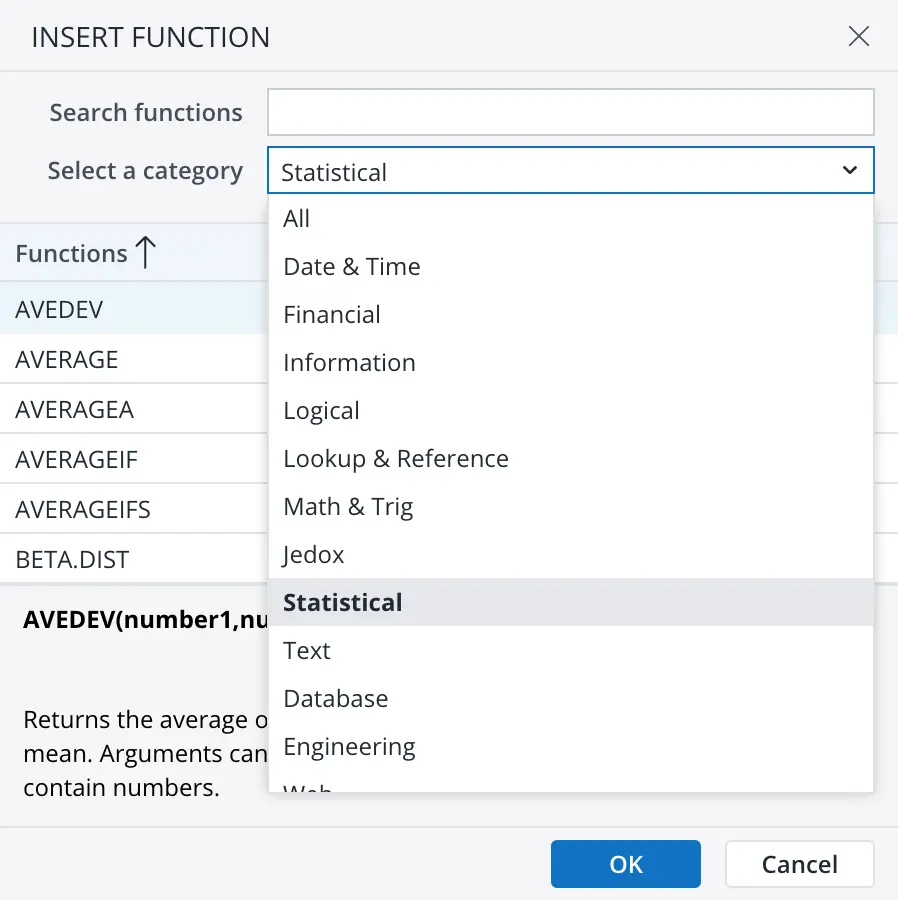
- Functions: Users can use a wide range of functions
to perform calculations in many areas like date/time, financial,
logical, lookup & reference, OLAP database, ODBC, statistical,
etc.
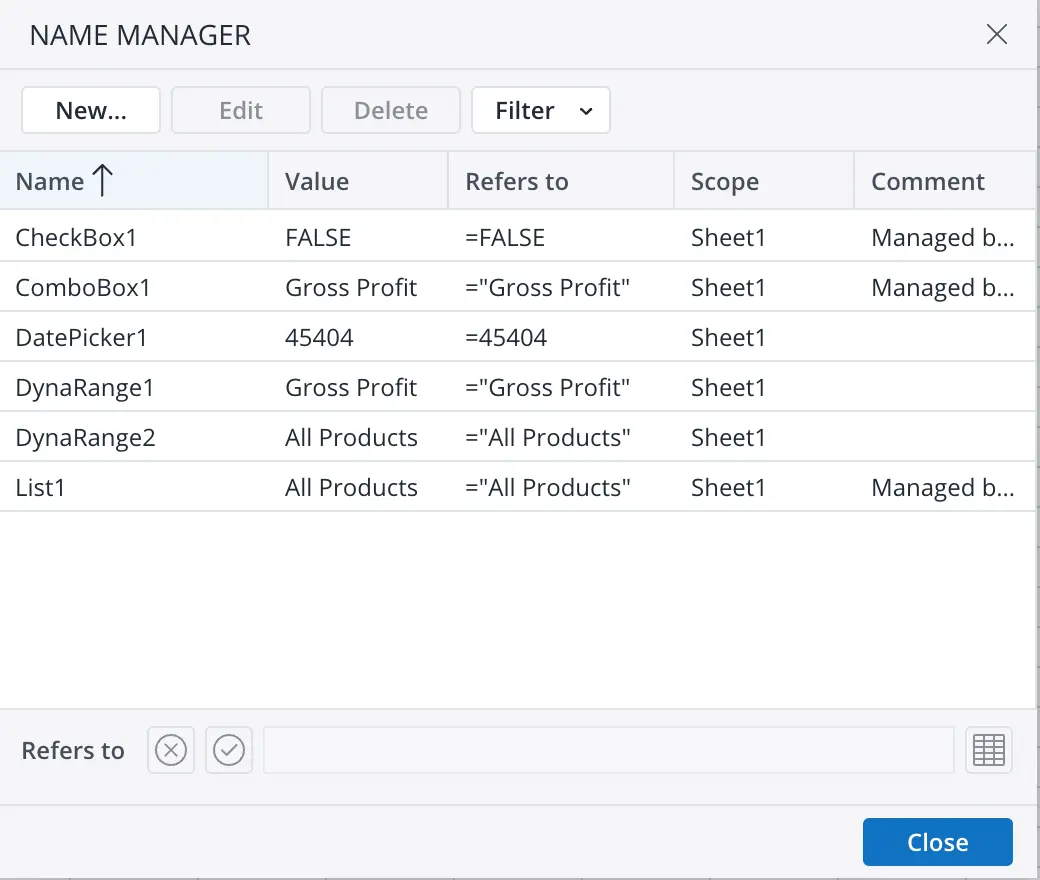
- Named ranges: References to specific cells or cell ranges in reports. Named ranges make it easier to create formulas and perform calculations by using descriptive names instead of cell references.
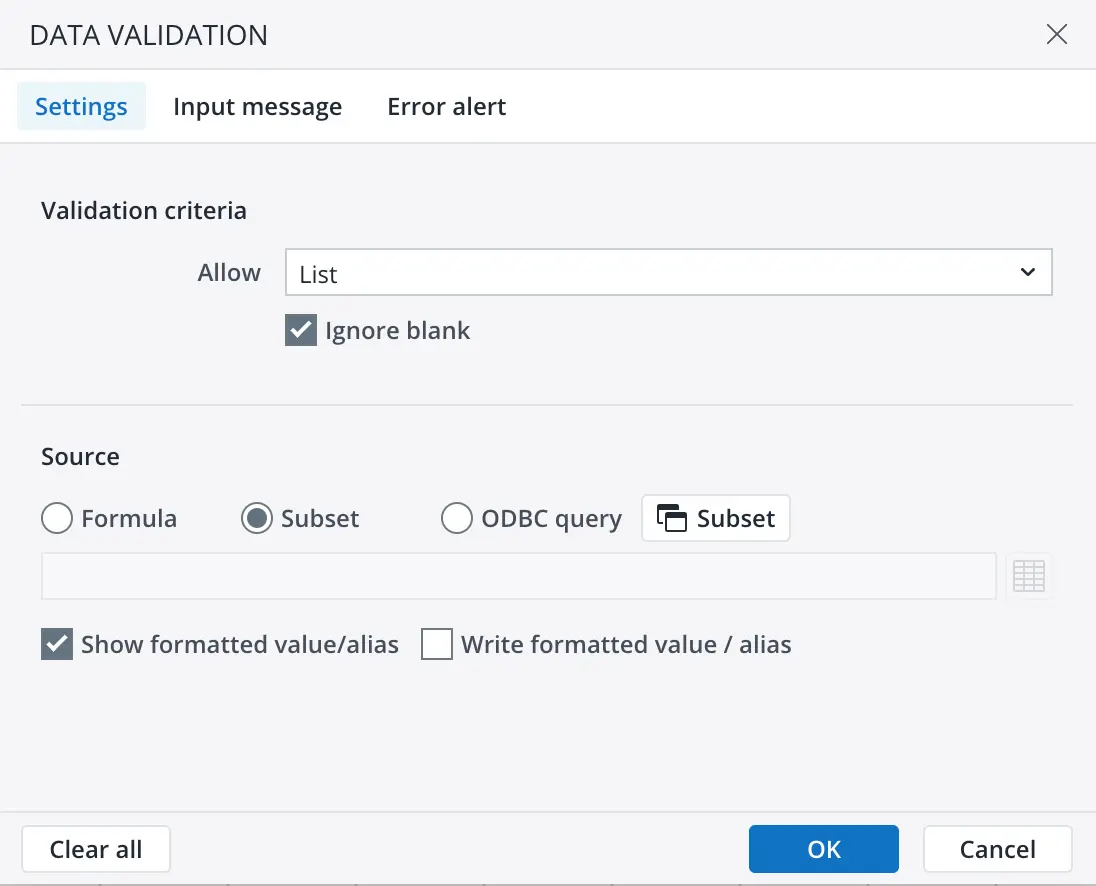
- Data validation: Rules to validate data entered in
cells, such as list, custom formula, OLAP subset, ODBC query,
etc.
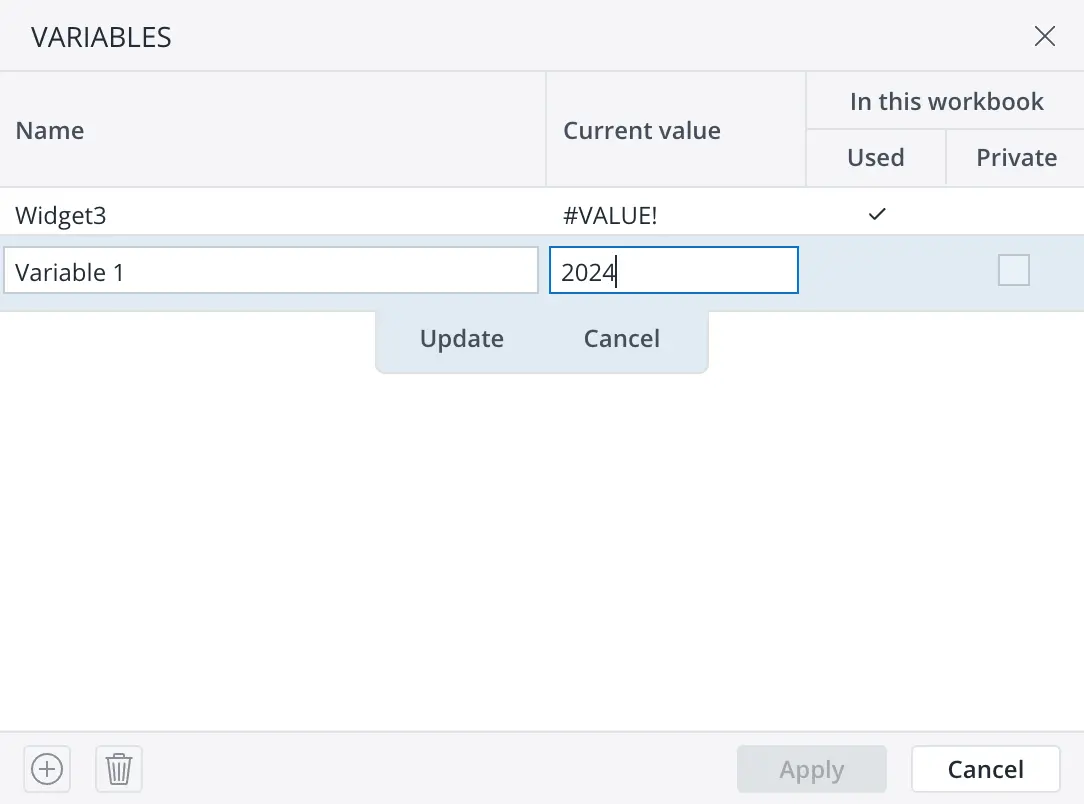
- Variables: Application-level variables to store values that can be referenced in different features like functions, form elements, hyperlinks, OLAP subsets, OLAP views, etc. Variables can be used to simplify complex calculations and make reports more dynamic and interactive.
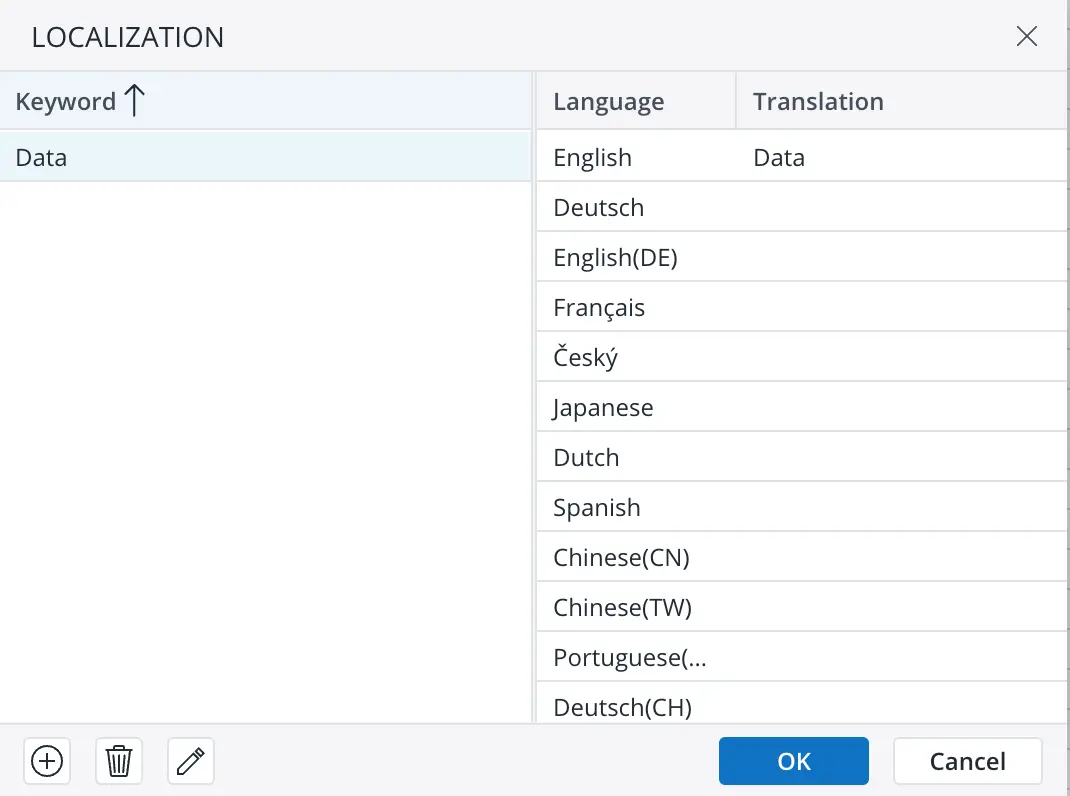
- Localization: This feature allows users to create reports in different languages to meet the needs of a global audience.
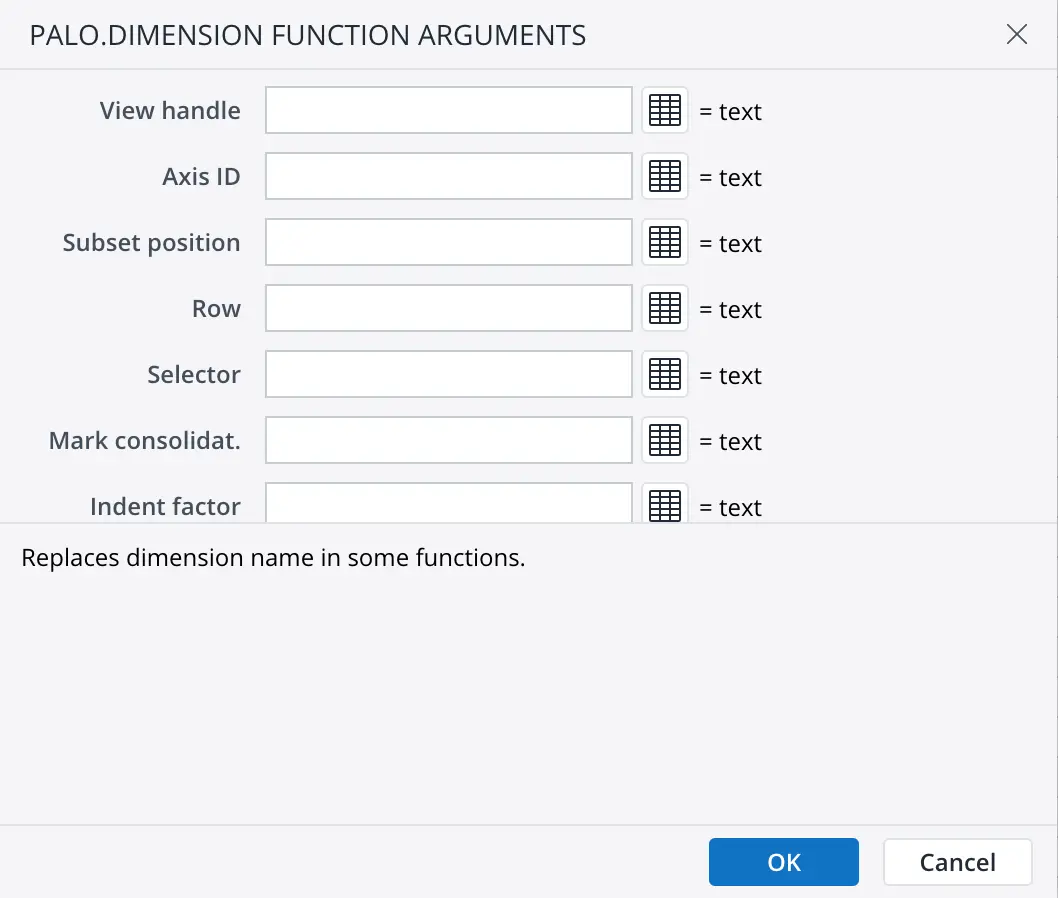
OLAP Database Query
Users can connect to an OLAP database and query data to create
reports with multidimensional data. They can use OLAP
functions to retrieve data from OLAP databases and display
it in reports, or use the following advanced features:
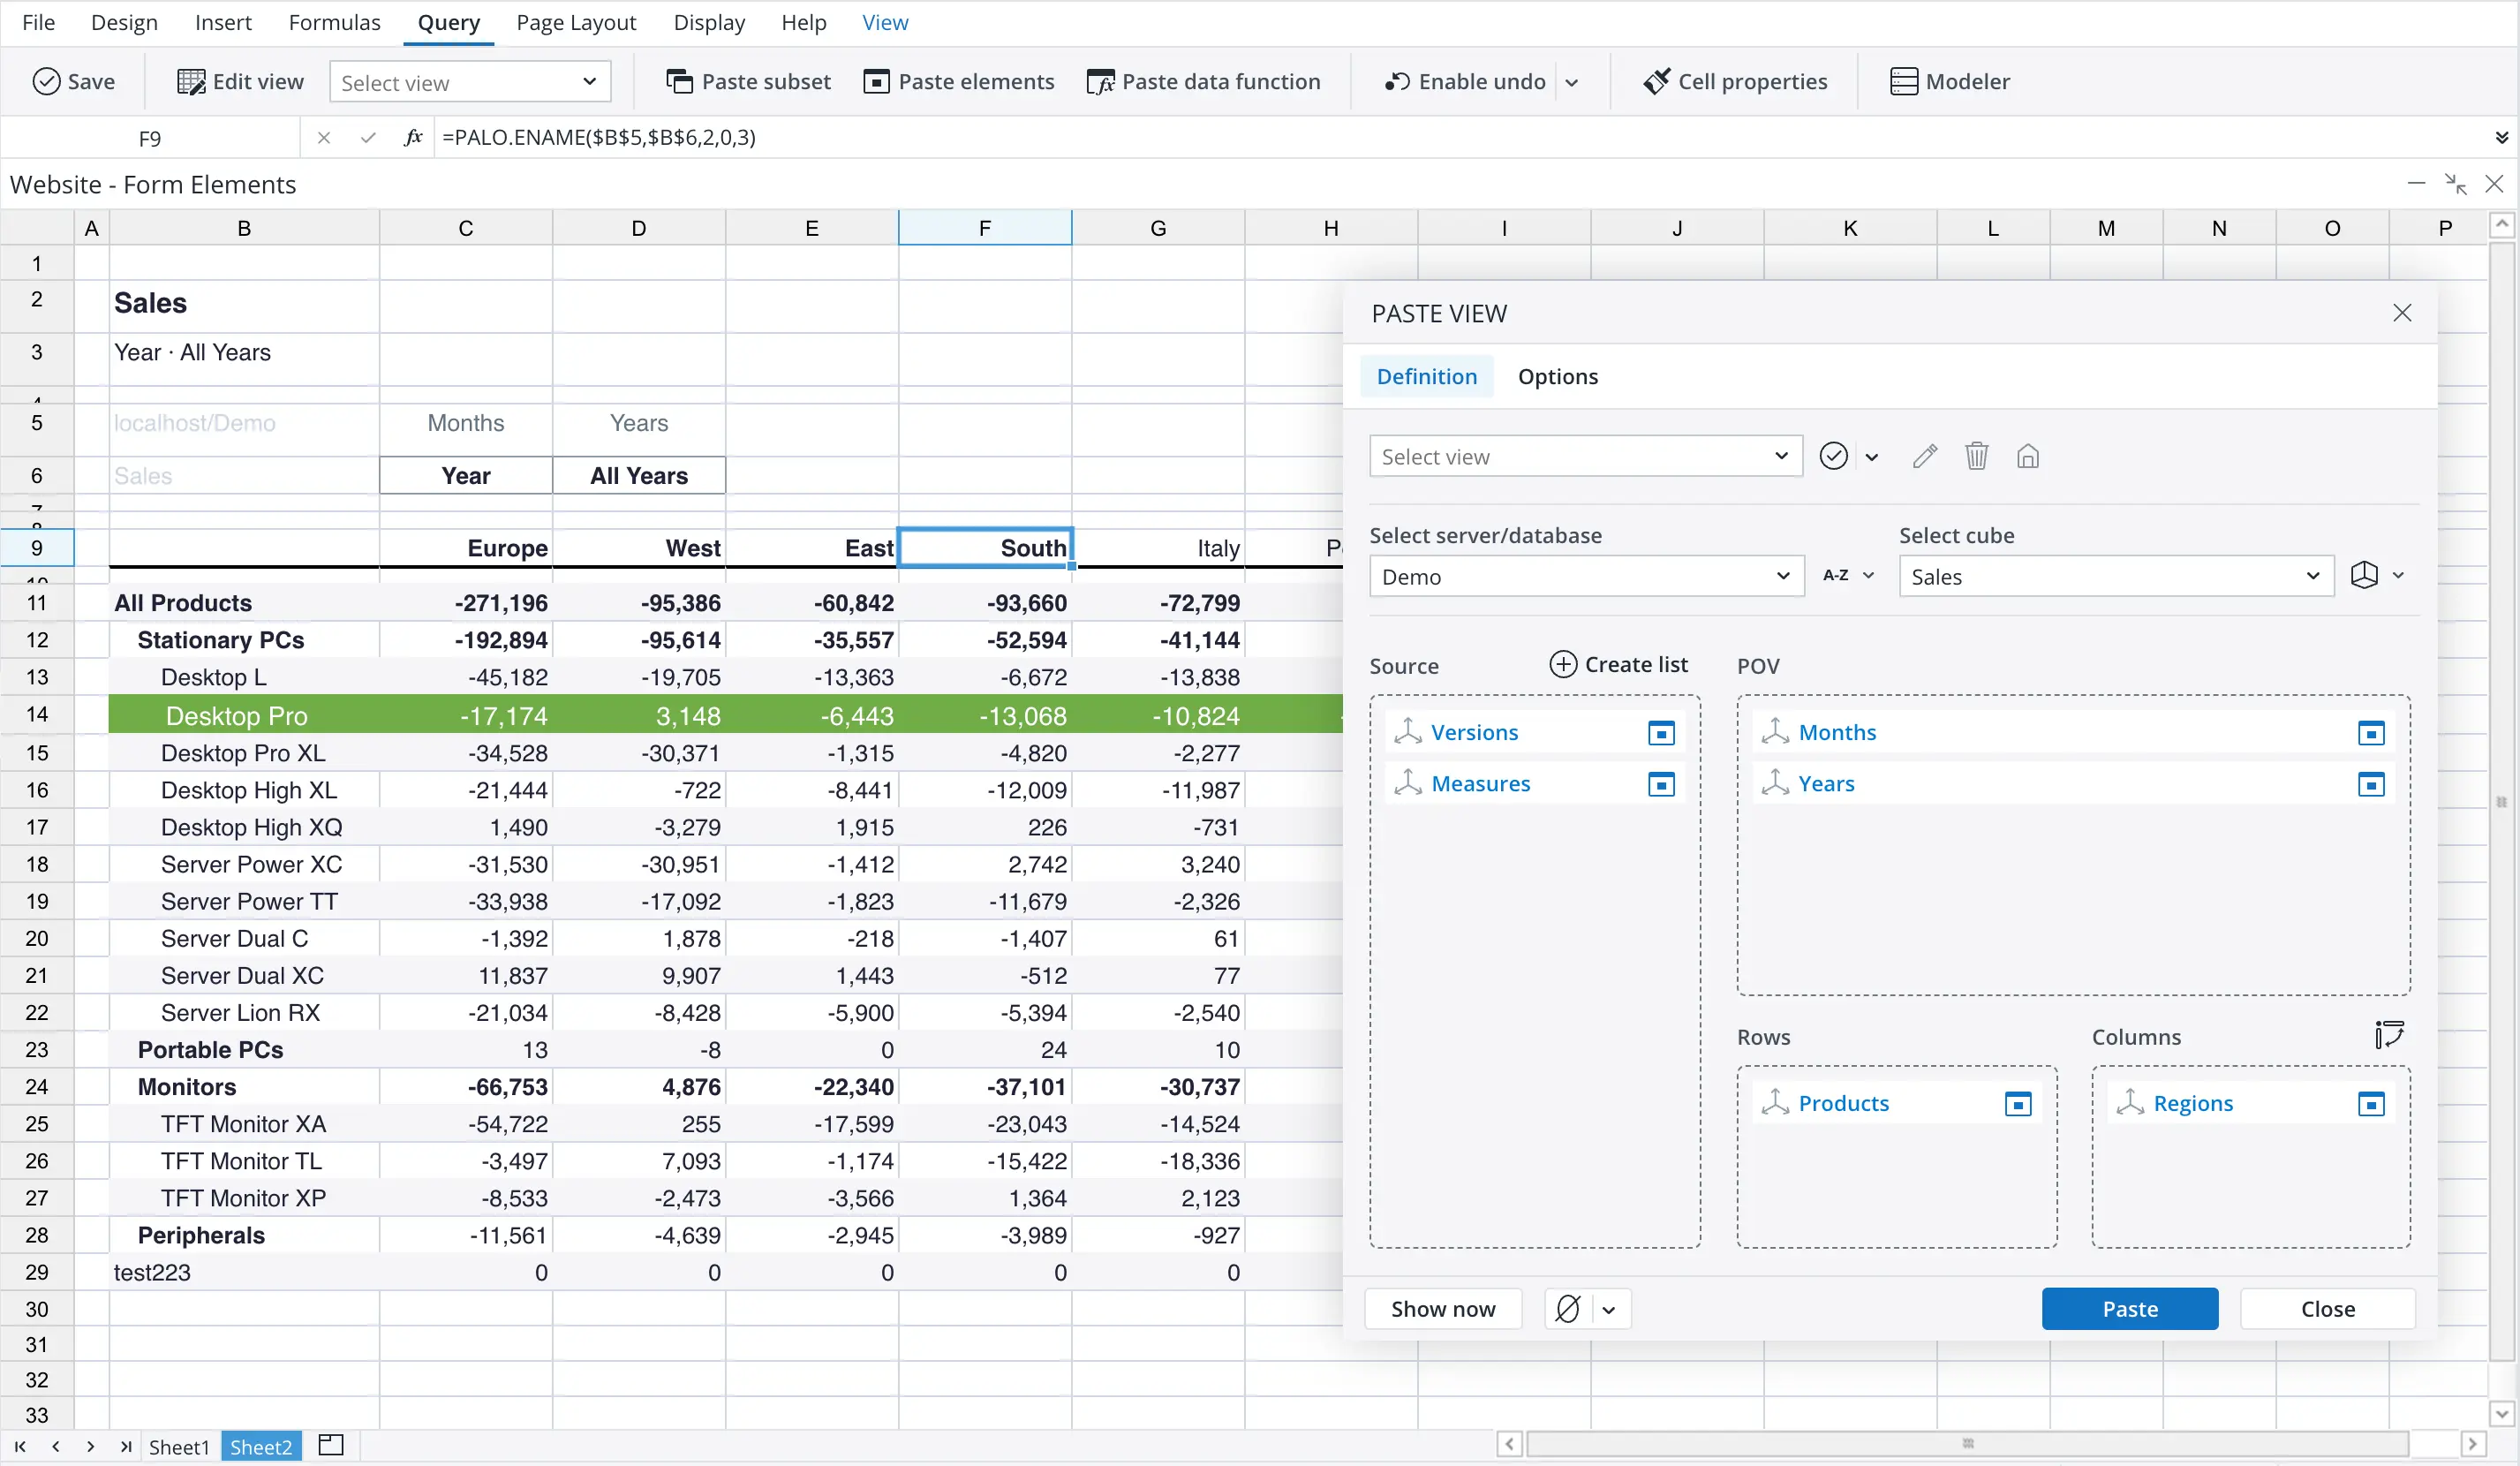
- Views: Designer can create and customize views of OLAP data cubes, enabling users to focus on specific subsets of data and analyze them in detail.
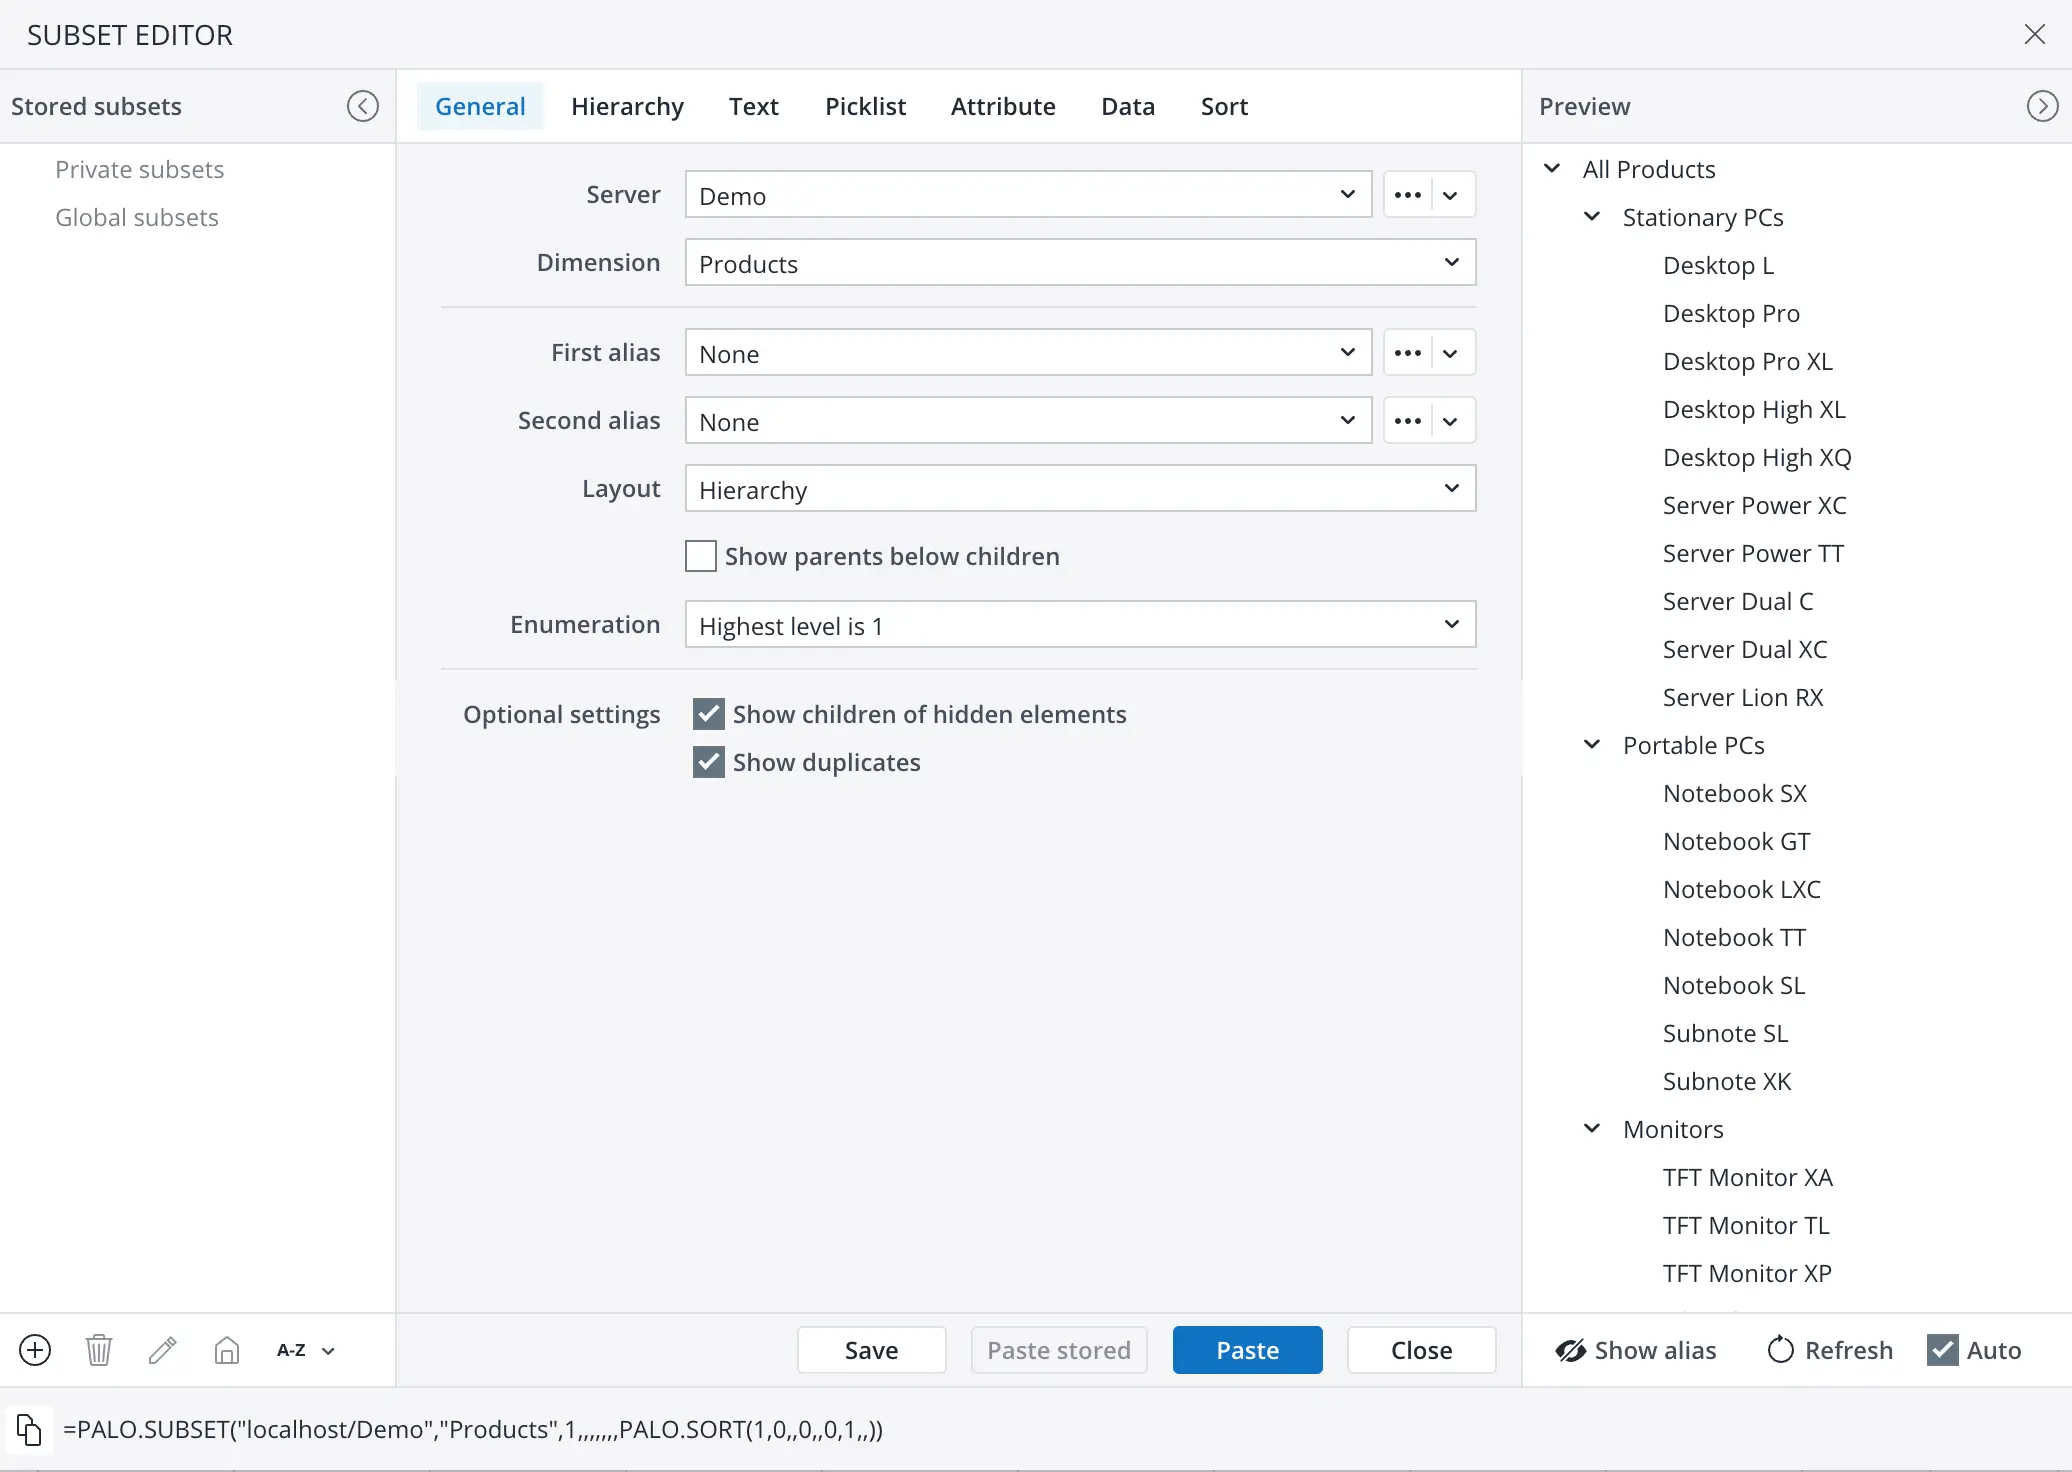
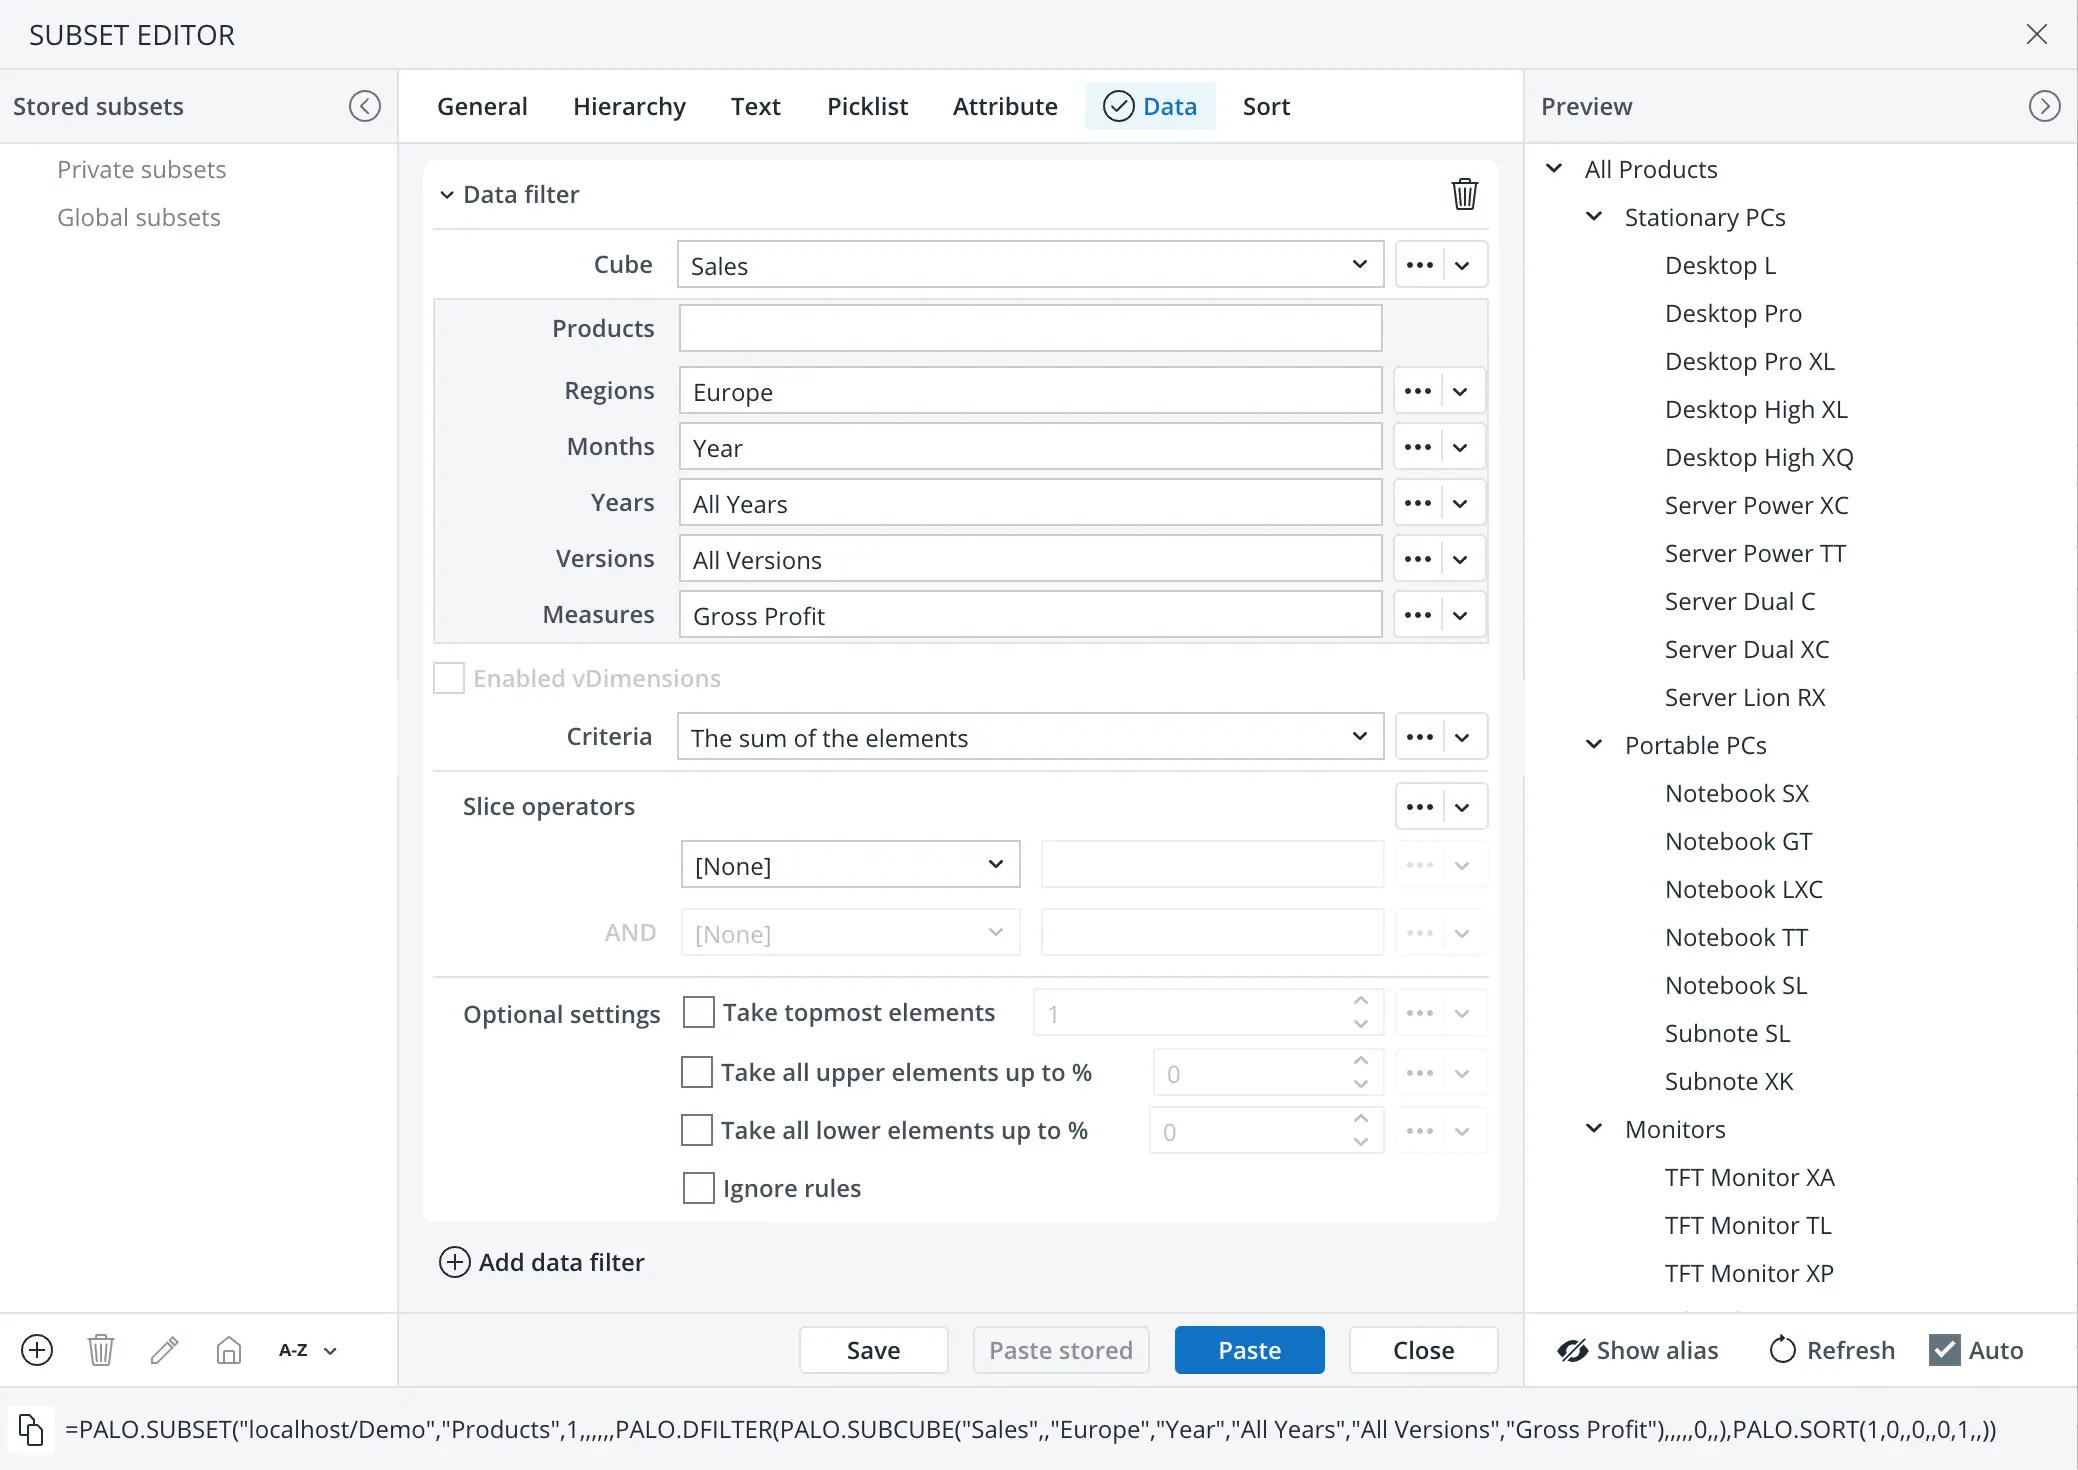
- Paste Subset: Users can paste OLAP subsets into reports to display specific elements from OLAP dimensions. They can customize the appearance of subsets by combining multiple filters, like hierarchy, text, picklist, attribute and data, or apply sorting to selected data.
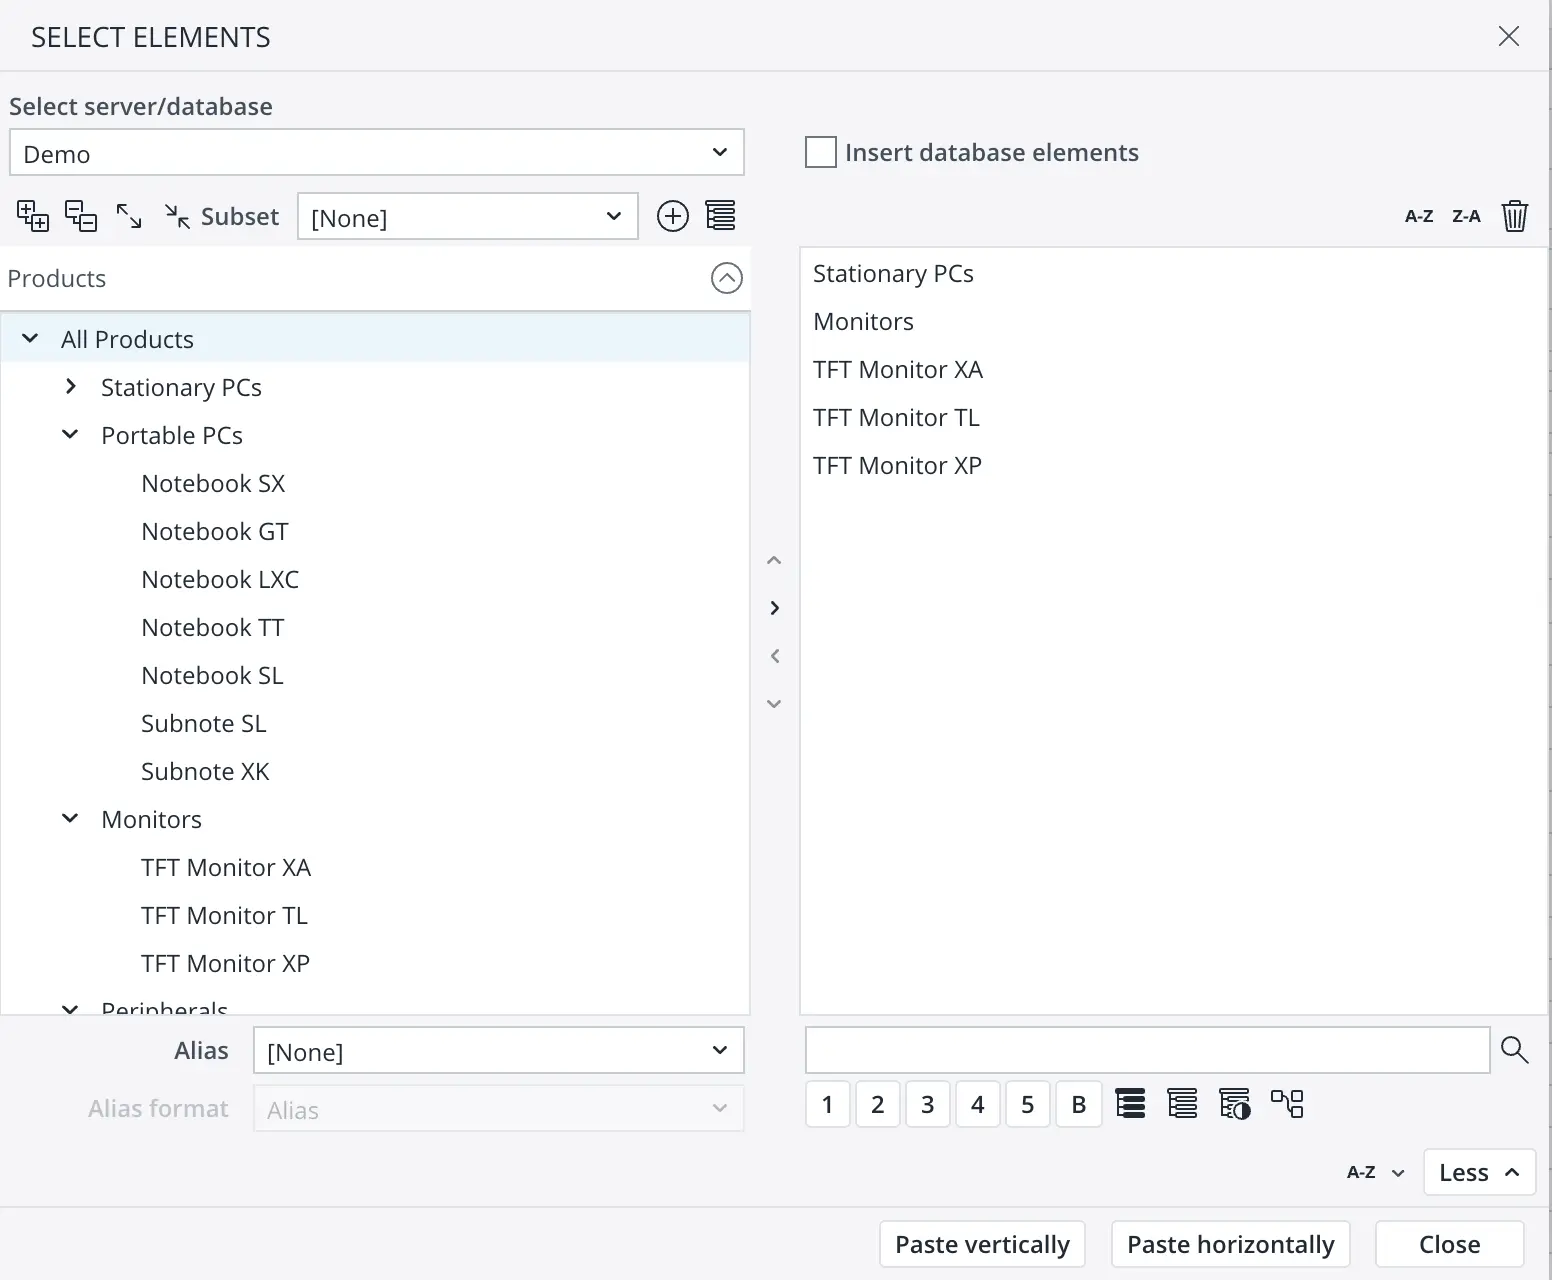
- Paste Elements: Paste OLAP elements into reports to
populate data from OLAP databases into spreadsheet cells.
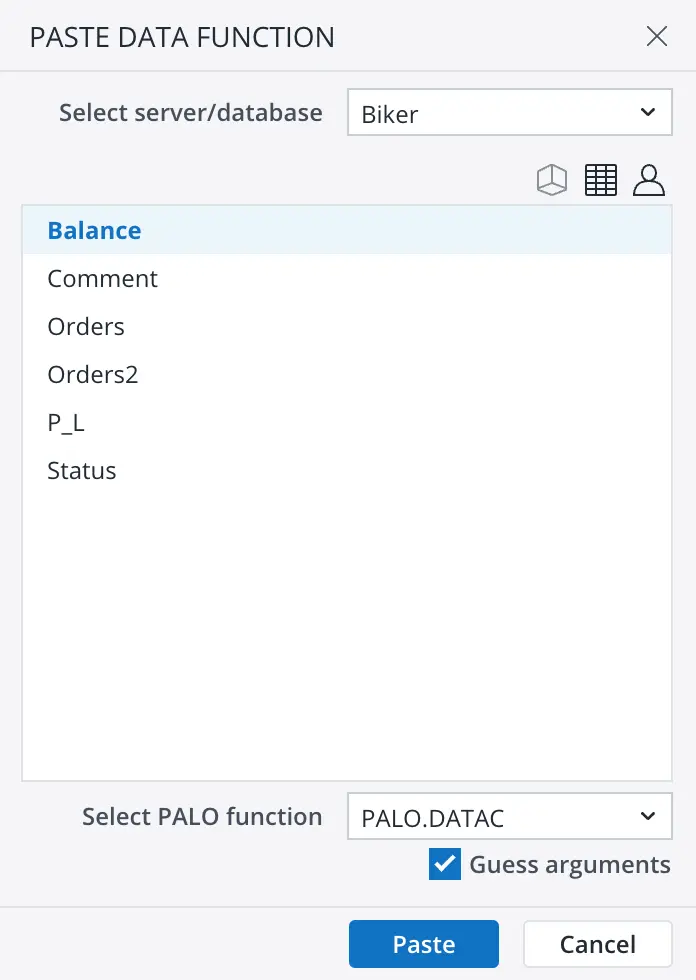
- Paste Data Function: Paste OLAP cell data in a
form of spreadsheet functions for data, attribute or user
cubes.
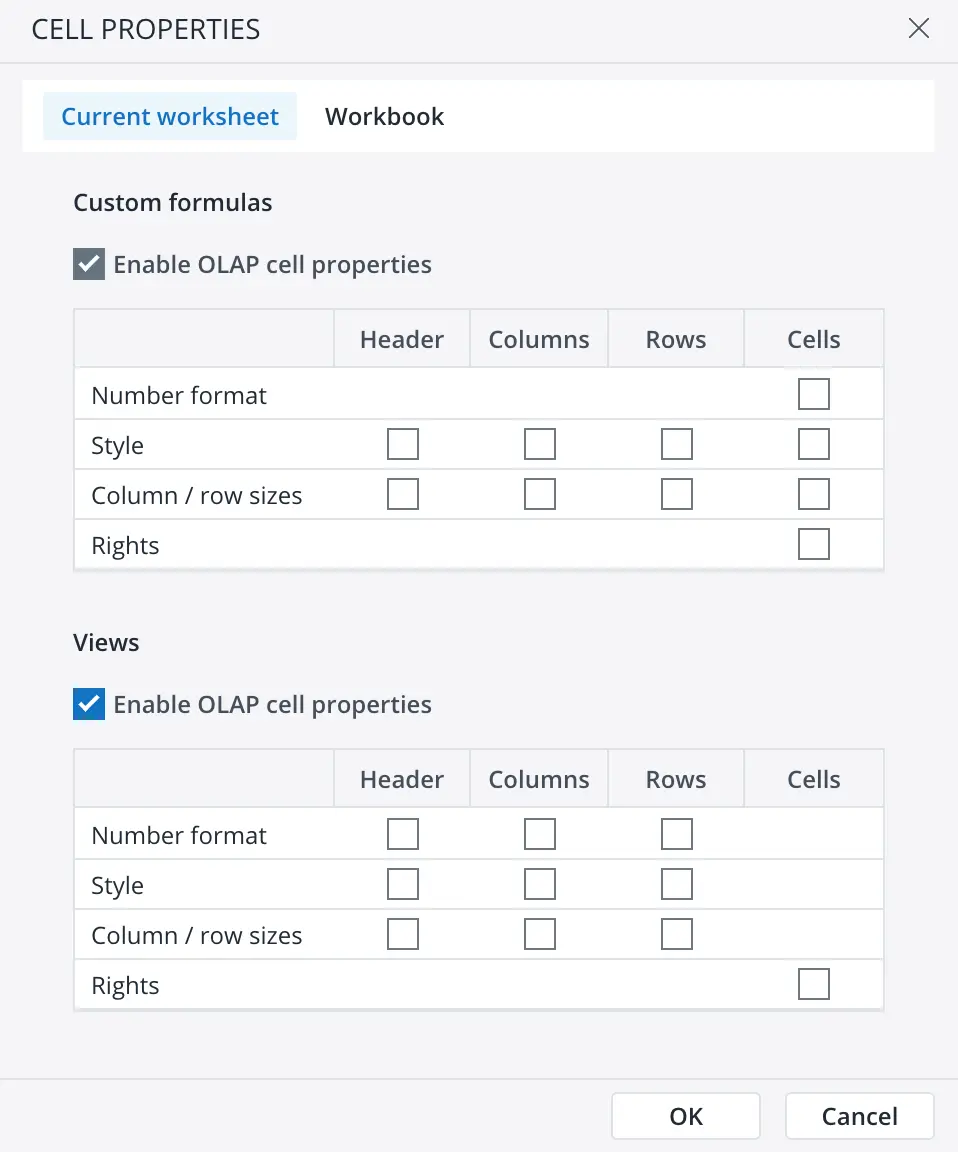
- Cell properties: Enable OLAP cell properties for views or custom formulas.
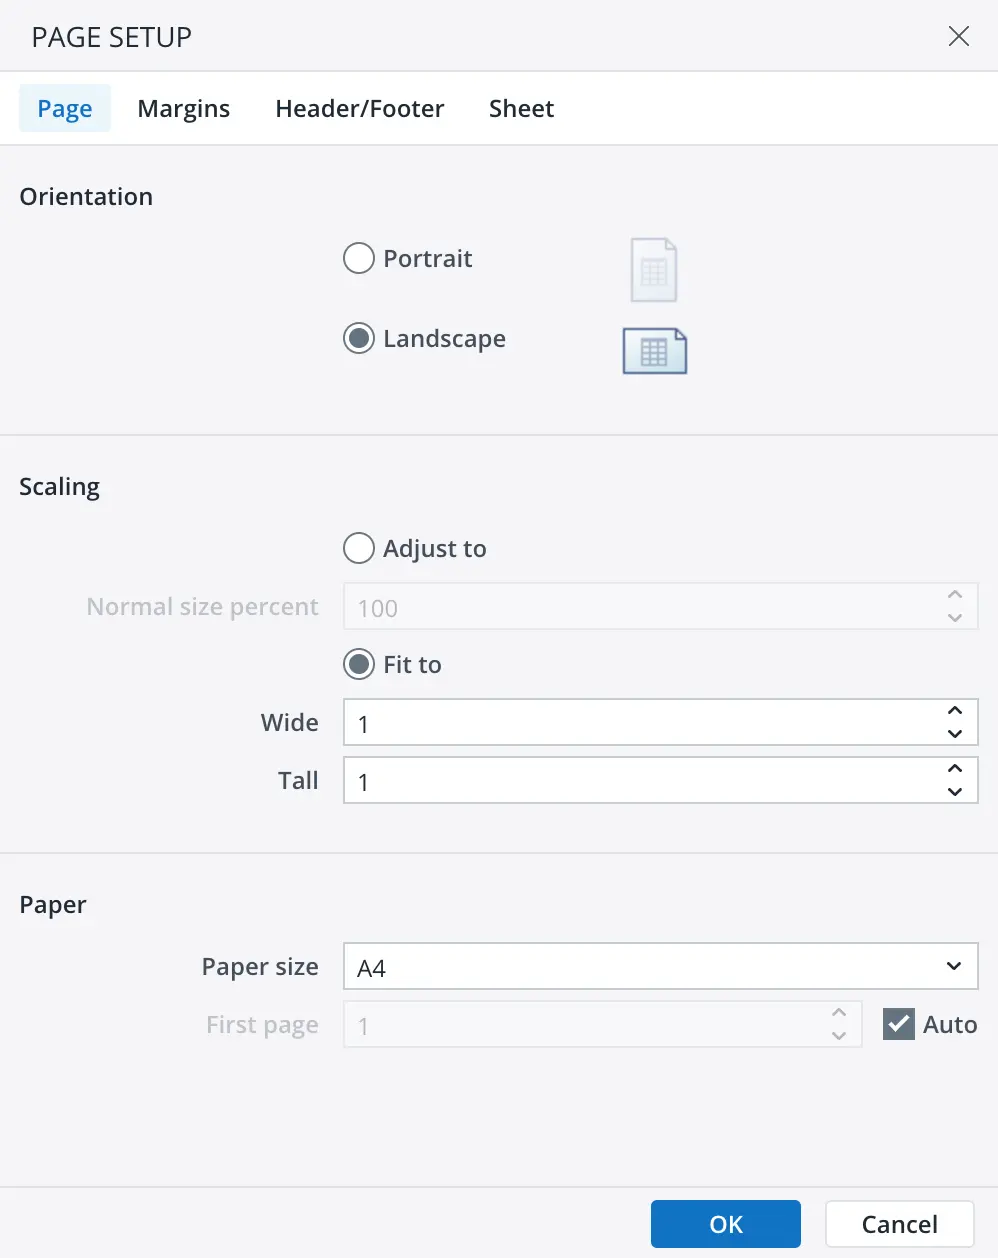
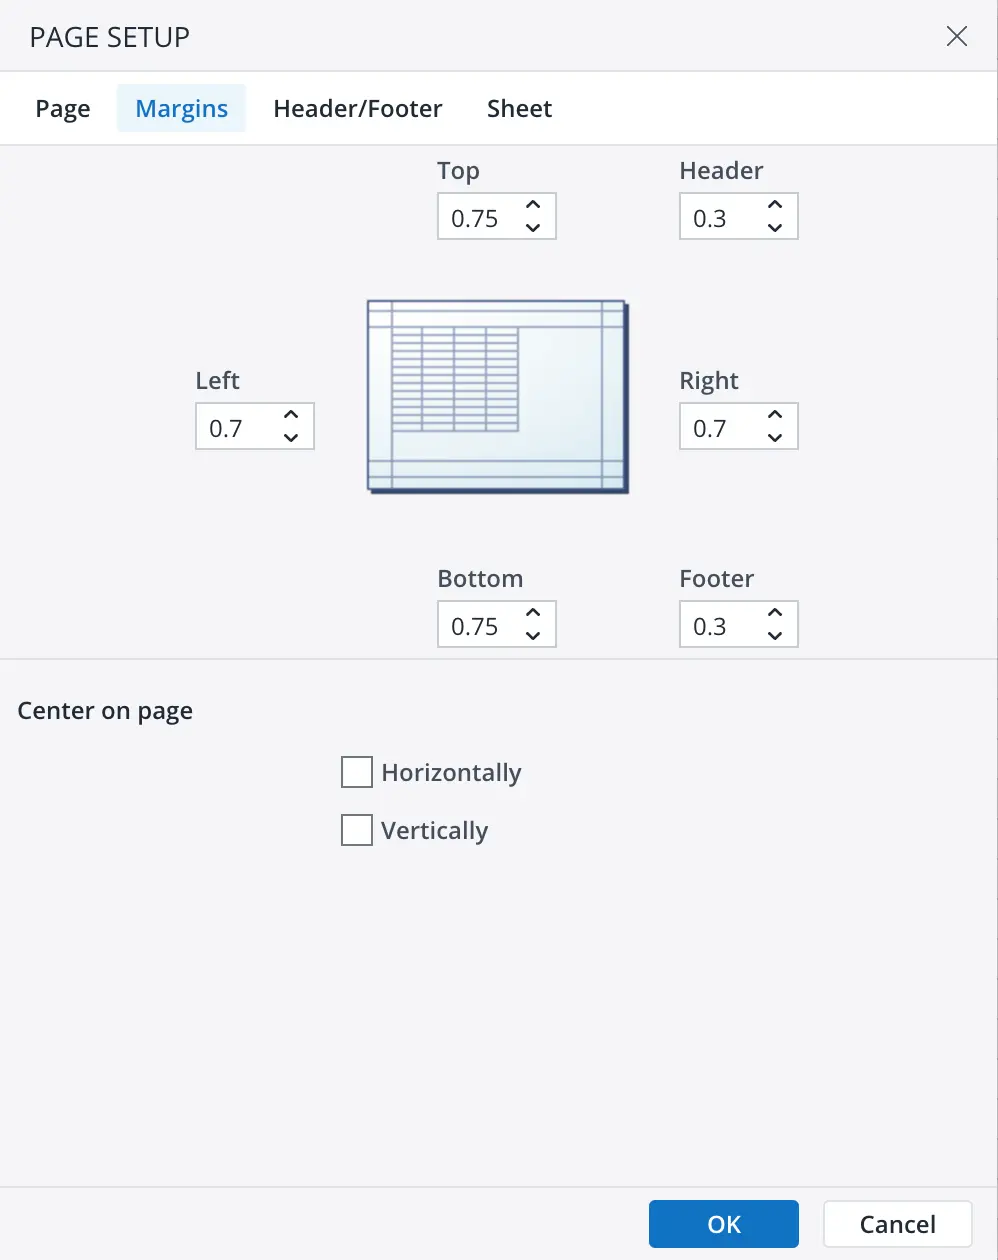
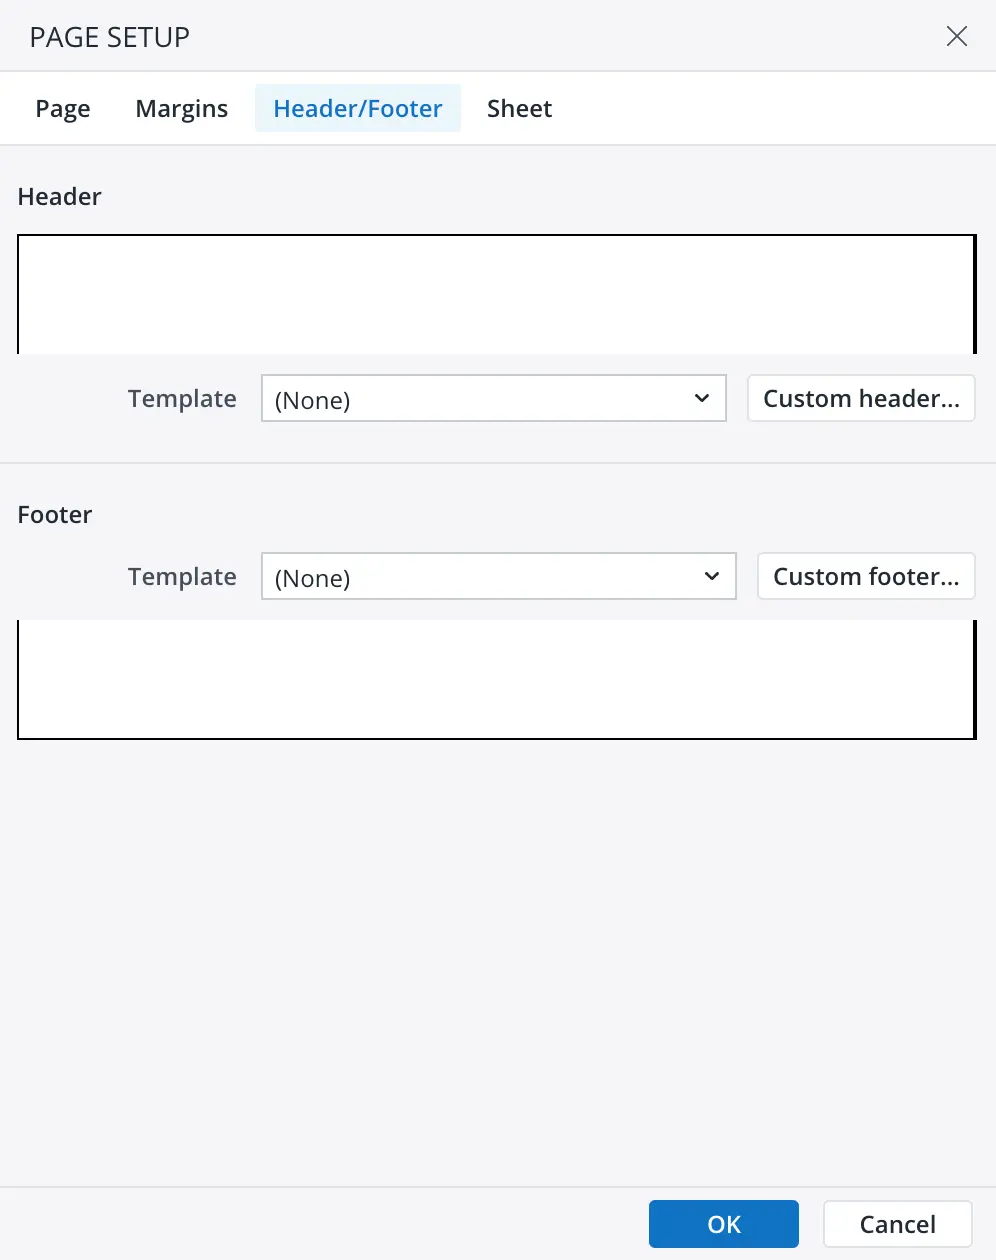
Page Layout
Designers can customize the appearance of reports by setting page properties, such as orientation, scaling, size, margins, and headers/footers, print area, print titles, gridlines and page order.
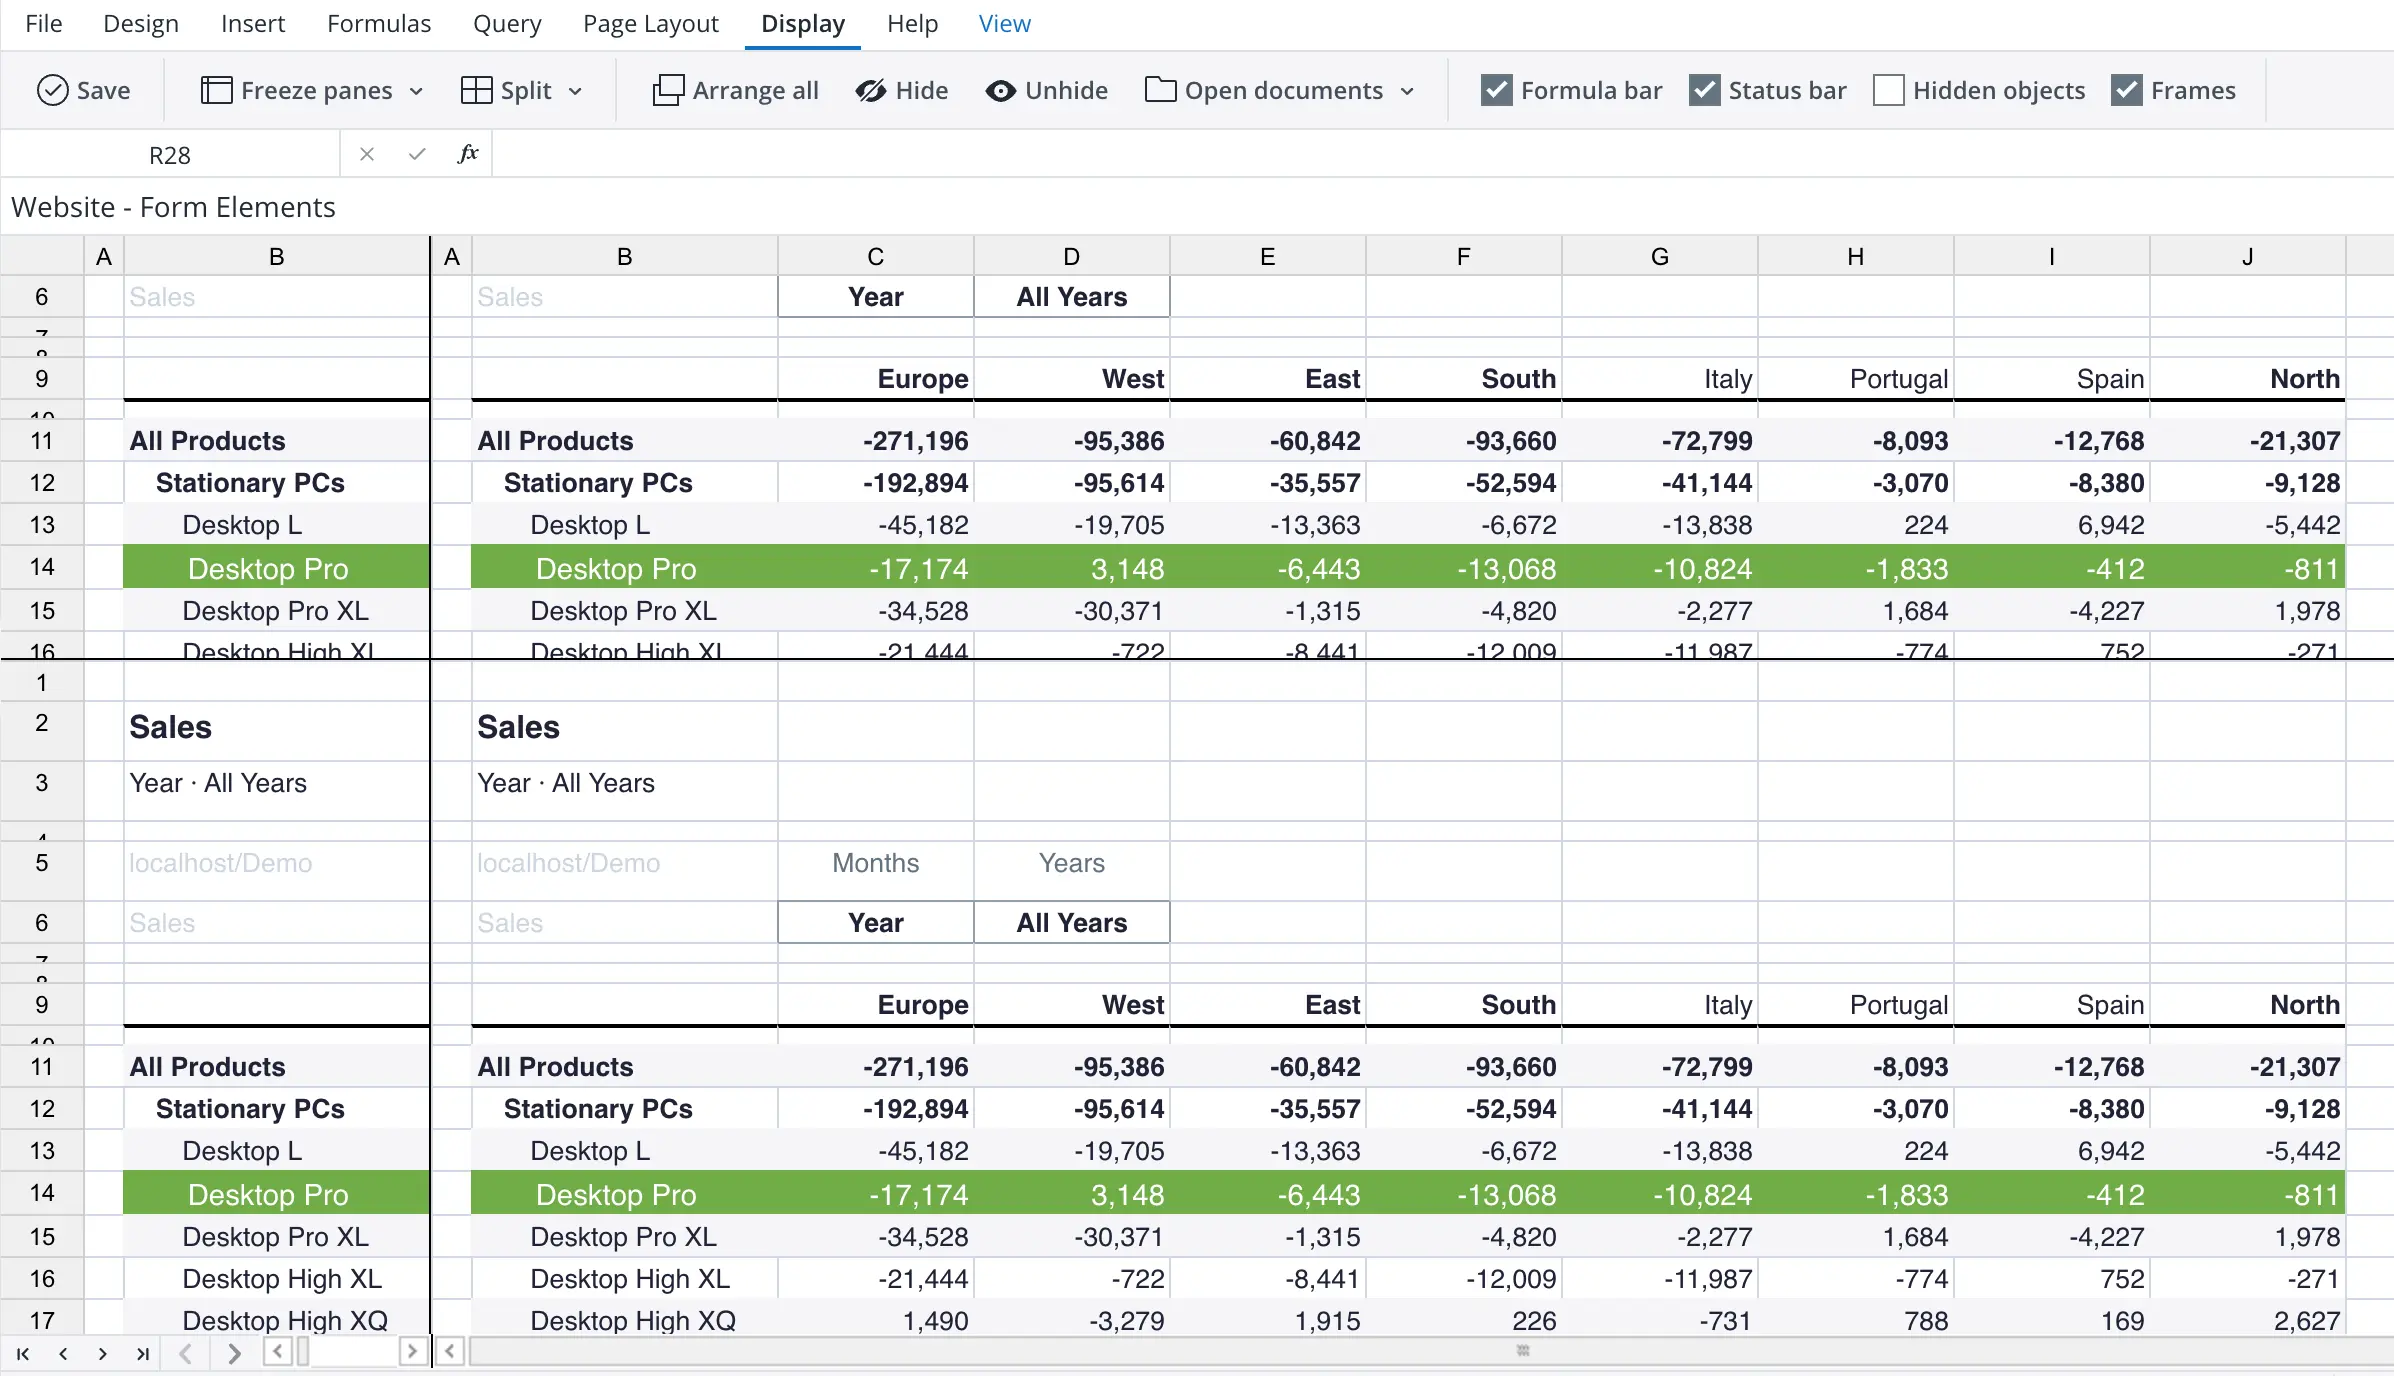
Advanced Display Options
Appearance of reports can be customized by setting display
options, such as:
- Freeze panes: Freeze rows and columns in reports is
available to keep them visible while scrolling through large
data sets.
- Split panes: The sheet can be split into two or four panes in order to improve the flexibility of viewing a report.
- Hide/show reports: Hide or show reports to focus on
specific data or reduce clutter.
- Arrange windows: Arrange multiple reports in the same window to compare data or create a dashboard view.
Let's turn your vision into results
Ready to transform your ideas into action?
Team up with us to craft tailored, innovative solutions that drive success.